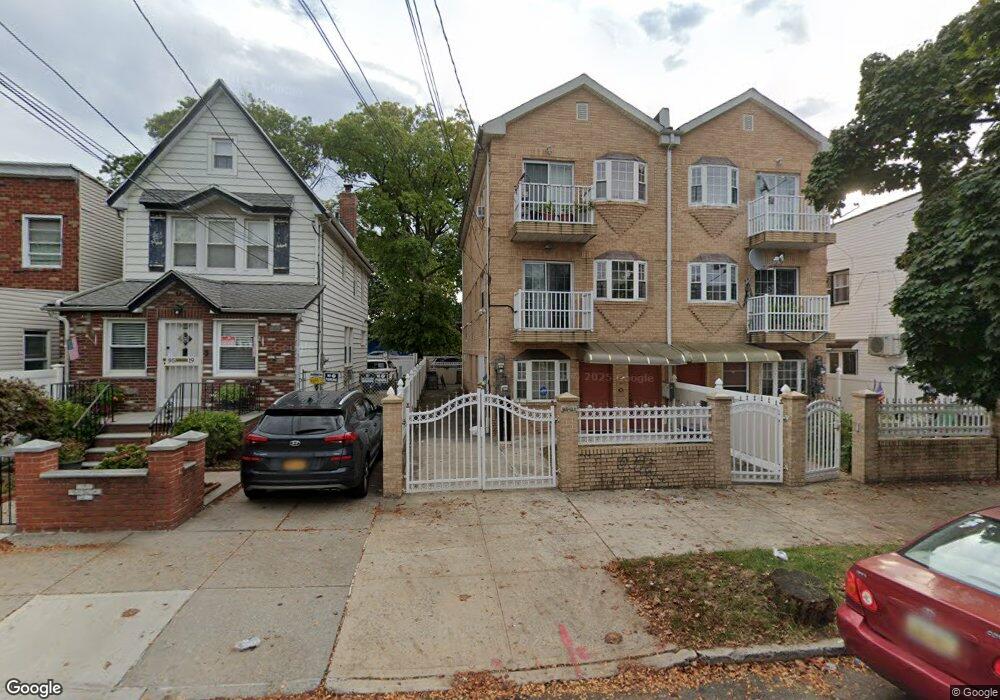
9521 94th St Ozone Park, NY 11416
Ozone Park NeighborhoodEstimated Value: $1,092,050 - $1,269,000
--
Bed
--
Bath
2,652
Sq Ft
$441/Sq Ft
Est. Value
About This Home
This home is located at 9521 94th St, Ozone Park, NY 11416 and is currently estimated at $1,168,763, approximately $440 per square foot. 9521 94th St is a home located in Queens County with nearby schools including P.S. 273, Santiam Elementary School, and Jhs 210 Elizabeth Blackwell.
Ownership History
Date
Name
Owned For
Owner Type
Purchase Details
Closed on
Nov 8, 2018
Sold by
Mangru Griha L
Bought by
Liu Yanfei and Lu Ming Shan
Current Estimated Value
Home Financials for this Owner
Home Financials are based on the most recent Mortgage that was taken out on this home.
Original Mortgage
$530,000
Outstanding Balance
$466,971
Interest Rate
4.9%
Mortgage Type
Unknown
Estimated Equity
$701,792
Purchase Details
Closed on
Nov 13, 2009
Sold by
Mangru Sheila and Mangru Thakoordeen
Bought by
Mangru Griha L
Home Financials for this Owner
Home Financials are based on the most recent Mortgage that was taken out on this home.
Original Mortgage
$562,168
Interest Rate
4.92%
Mortgage Type
Purchase Money Mortgage
Purchase Details
Closed on
Jun 18, 2009
Sold by
Hunny Development Llc
Bought by
Mangru Sheila and Mangru Thakoordeen
Create a Home Valuation Report for This Property
The Home Valuation Report is an in-depth analysis detailing your home's value as well as a comparison with similar homes in the area
Home Values in the Area
Average Home Value in this Area
Purchase History
| Date | Buyer | Sale Price | Title Company |
|---|---|---|---|
| Liu Yanfei | $950,000 | -- | |
| Mangru Griha L | $650,000 | -- | |
| Mangru Sheila | -- | -- |
Source: Public Records
Mortgage History
| Date | Status | Borrower | Loan Amount |
|---|---|---|---|
| Open | Liu Yanfei | $530,000 | |
| Previous Owner | Mangru Griha L | $562,168 |
Source: Public Records
Tax History Compared to Growth
Tax History
| Year | Tax Paid | Tax Assessment Tax Assessment Total Assessment is a certain percentage of the fair market value that is determined by local assessors to be the total taxable value of land and additions on the property. | Land | Improvement |
|---|---|---|---|---|
| 2025 | $9,579 | $50,554 | $12,608 | $37,946 |
| 2024 | $9,579 | $47,693 | $12,071 | $35,622 |
| 2023 | $9,579 | $47,693 | $13,274 | $34,419 |
| 2022 | $9,449 | $66,060 | $18,420 | $47,640 |
| 2021 | $9,398 | $56,880 | $18,420 | $38,460 |
| 2020 | $8,917 | $56,580 | $18,420 | $38,160 |
| 2019 | $8,314 | $51,000 | $18,420 | $32,580 |
| 2018 | $8,102 | $39,744 | $14,508 | $25,236 |
| 2017 | $8,041 | $39,445 | $16,588 | $22,857 |
| 2016 | $7,439 | $39,445 | $16,588 | $22,857 |
| 2015 | $5,081 | $35,107 | $18,084 | $17,023 |
| 2014 | $5,081 | $33,120 | $20,460 | $12,660 |
Source: Public Records
Map
Nearby Homes