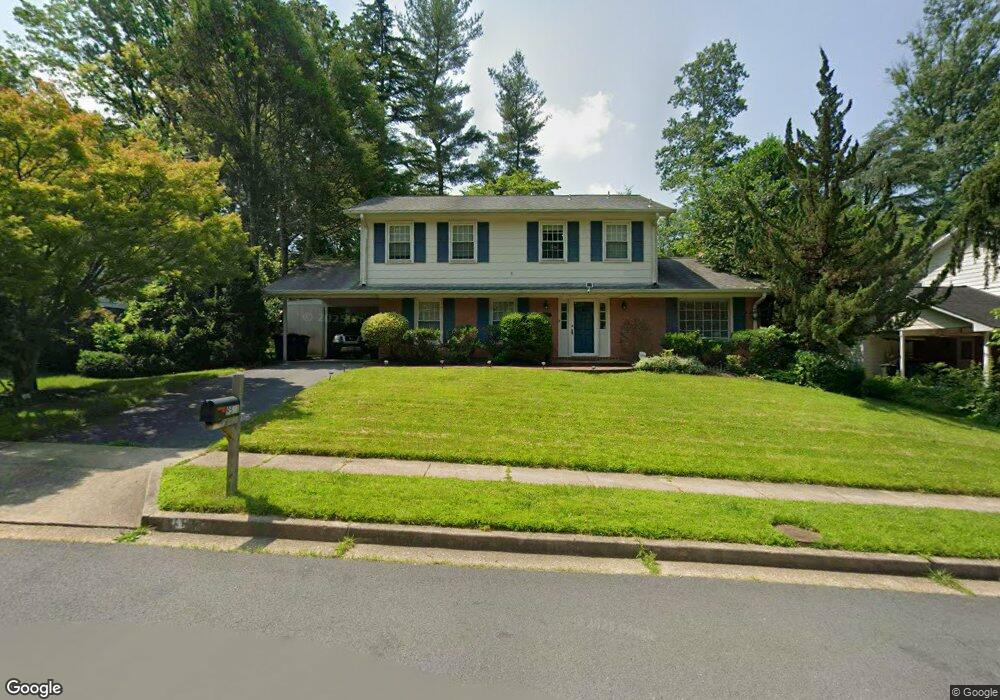
9521 Stevebrook Rd Unit 6050 Fairfax, VA 22032
Estimated Value: $840,007 - $980,000
4
Beds
3
Baths
2,028
Sq Ft
$447/Sq Ft
Est. Value
About This Home
This home is located at 9521 Stevebrook Rd Unit 6050, Fairfax, VA 22032 and is currently estimated at $906,002, approximately $446 per square foot. 9521 Stevebrook Rd Unit 6050 is a home located in Fairfax County with nearby schools including Olde Creek Elementary School, Frost Middle School, and W. T. Woodson High School.
Ownership History
Date
Name
Owned For
Owner Type
Purchase Details
Closed on
Aug 9, 2019
Sold by
Bauman Meghan C
Bought by
Causey Geoffrey B and Causey Desiree G
Current Estimated Value
Home Financials for this Owner
Home Financials are based on the most recent Mortgage that was taken out on this home.
Original Mortgage
$484,000
Outstanding Balance
$424,156
Interest Rate
3.73%
Mortgage Type
New Conventional
Estimated Equity
$481,846
Purchase Details
Closed on
Dec 23, 2015
Sold by
Titus Susan E
Bought by
Bauman John M and Bauman Meghan C
Home Financials for this Owner
Home Financials are based on the most recent Mortgage that was taken out on this home.
Original Mortgage
$479,700
Interest Rate
3.99%
Mortgage Type
New Conventional
Create a Home Valuation Report for This Property
The Home Valuation Report is an in-depth analysis detailing your home's value as well as a comparison with similar homes in the area
Home Values in the Area
Average Home Value in this Area
Purchase History
| Date | Buyer | Sale Price | Title Company |
|---|---|---|---|
| Causey Geoffrey B | $617,000 | Universal Title | |
| Bauman John M | $533,000 | Mid Altantic Settlement Svcs |
Source: Public Records
Mortgage History
| Date | Status | Borrower | Loan Amount |
|---|---|---|---|
| Open | Causey Geoffrey B | $484,000 | |
| Previous Owner | Bauman John M | $479,700 |
Source: Public Records
Tax History Compared to Growth
Tax History
| Year | Tax Paid | Tax Assessment Tax Assessment Total Assessment is a certain percentage of the fair market value that is determined by local assessors to be the total taxable value of land and additions on the property. | Land | Improvement |
|---|---|---|---|---|
| 2025 | $8,689 | $825,070 | $330,000 | $495,070 |
| 2024 | $8,689 | $750,060 | $300,000 | $450,060 |
| 2023 | $8,204 | $726,950 | $290,000 | $436,950 |
| 2022 | $7,801 | $682,220 | $270,000 | $412,220 |
| 2021 | $7,526 | $641,370 | $245,000 | $396,370 |
| 2020 | $7,047 | $595,440 | $225,000 | $370,440 |
| 2019 | $6,784 | $573,180 | $210,000 | $363,180 |
| 2018 | $6,393 | $555,890 | $210,000 | $345,890 |
| 2017 | $6,454 | $555,890 | $210,000 | $345,890 |
| 2016 | $6,286 | $542,590 | $210,000 | $332,590 |
| 2015 | $5,739 | $514,290 | $204,000 | $310,290 |
| 2014 | $5,359 | $481,310 | $194,000 | $287,310 |
Source: Public Records
Map
Nearby Homes
- 4906 Mcfarland Dr
- 4869 Nash Dr
- 4222 Braeburn Dr
- 4301 Braeburn Dr
- 9308 Ashmeade Dr
- 5037 Head Ct
- 4314 Selkirk Dr
- 4903 King David Blvd
- 10134 Red Spruce Rd
- 5090 Queens Wood Dr
- 9883 Becket Ct
- 10021 Glenmere Rd
- 5254 Queens Wood Dr
- 9017 Ellenwood Ln
- 4773 Farndon Ct
- 5055 Kenerson Dr
- 5009 King David Blvd
- 4768 Farndon Ct
- 9117 Hunting Pines Place
- 9900 Barbara Ann Ln
- 9521 Stevebrook Rd
- 9523 Stevebrook Rd
- 9519 Stevebrook Rd
- 9526 Jomar Dr
- 9528 Jomar Dr
- 9525 Stevebrook Rd
- 9524 Jomar Dr
- 9520 Stevebrook Rd
- 9517 Stevebrook Rd
- 9518 Stevebrook Rd
- 9522 Stevebrook Rd
- 9530 Jomar Dr
- 9524 Stevebrook Rd
- 9529 Stevebrook Rd
- 9522 Jomar Dr
- 9516 Stevebrook Rd
- 9535 Stevebrook Rd
- 9514 Stevebrook Rd
- 9526 Stevebrook Rd
- 9525 Jomar Dr