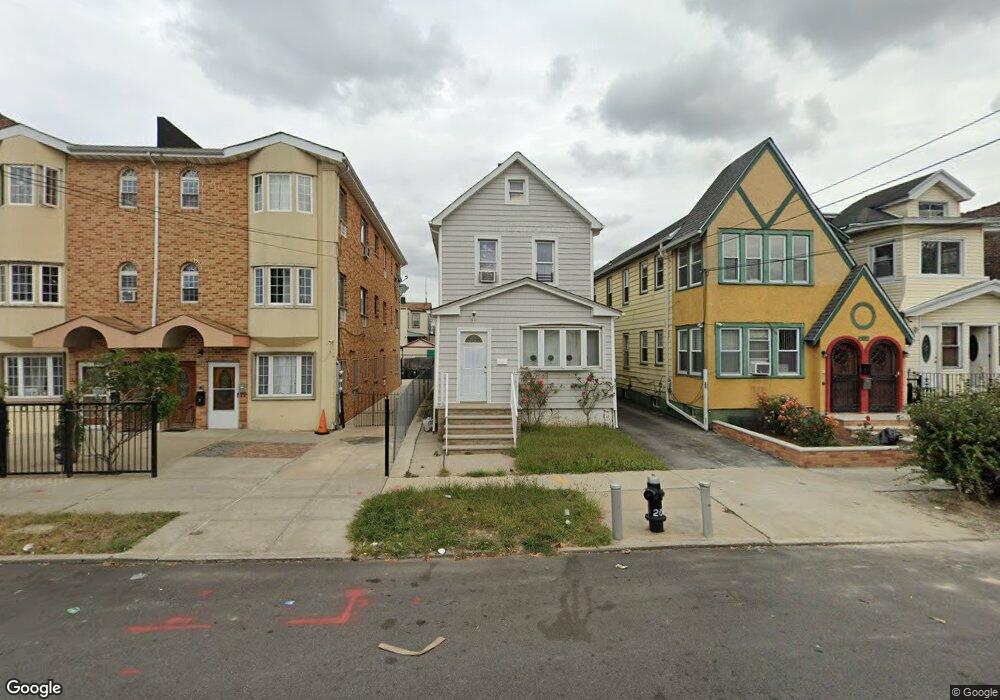
9523 111th St South Richmond Hill, NY 11419
Richmond Hill NeighborhoodEstimated Value: $666,000 - $1,069,000
--
Bed
--
Bath
1,290
Sq Ft
$628/Sq Ft
Est. Value
About This Home
This home is located at 9523 111th St, South Richmond Hill, NY 11419 and is currently estimated at $809,868, approximately $627 per square foot. 9523 111th St is a home located in Queens County with nearby schools including P.S. 62 - Chester Park, M.S.137 America's School of Heroes, and Richmond Hill High School.
Ownership History
Date
Name
Owned For
Owner Type
Purchase Details
Closed on
Apr 21, 2004
Sold by
Boodram Debbie N
Bought by
Boodram Debbie N and Boodram Steve
Current Estimated Value
Purchase Details
Closed on
Apr 25, 2000
Sold by
Aponte Jose M and Aponte Zoila E Reyes
Bought by
Boodram Debbie N
Home Financials for this Owner
Home Financials are based on the most recent Mortgage that was taken out on this home.
Original Mortgage
$176,892
Outstanding Balance
$59,605
Interest Rate
8.21%
Mortgage Type
FHA
Estimated Equity
$750,263
Create a Home Valuation Report for This Property
The Home Valuation Report is an in-depth analysis detailing your home's value as well as a comparison with similar homes in the area
Home Values in the Area
Average Home Value in this Area
Purchase History
| Date | Buyer | Sale Price | Title Company |
|---|---|---|---|
| Boodram Debbie N | -- | -- | |
| Boodram Debbie N | -- | -- | |
| Boodram Debbie N | $177,500 | Stewart Title | |
| Boodram Debbie N | $177,500 | Stewart Title |
Source: Public Records
Mortgage History
| Date | Status | Borrower | Loan Amount |
|---|---|---|---|
| Open | Boodram Debbie N | $176,892 | |
| Closed | Boodram Debbie N | $176,892 | |
| Closed | Boodram Debbie N | $0 |
Source: Public Records
Tax History Compared to Growth
Tax History
| Year | Tax Paid | Tax Assessment Tax Assessment Total Assessment is a certain percentage of the fair market value that is determined by local assessors to be the total taxable value of land and additions on the property. | Land | Improvement |
|---|---|---|---|---|
| 2025 | $6,563 | $34,612 | $11,521 | $23,091 |
| 2024 | $6,563 | $32,674 | $11,292 | $21,382 |
| 2023 | $6,217 | $30,954 | $9,951 | $21,003 |
| 2022 | $5,837 | $39,840 | $14,100 | $25,740 |
| 2021 | $6,070 | $35,400 | $14,100 | $21,300 |
| 2020 | $6,105 | $32,940 | $14,100 | $18,840 |
| 2019 | $5,696 | $29,400 | $14,100 | $15,300 |
| 2018 | $5,258 | $25,795 | $12,816 | $12,979 |
| 2017 | $4,967 | $24,364 | $10,702 | $13,662 |
| 2016 | $4,805 | $24,364 | $10,702 | $13,662 |
| 2015 | $2,552 | $24,036 | $13,697 | $10,339 |
| 2014 | $2,552 | $22,690 | $12,791 | $9,899 |
Source: Public Records
Map
Nearby Homes