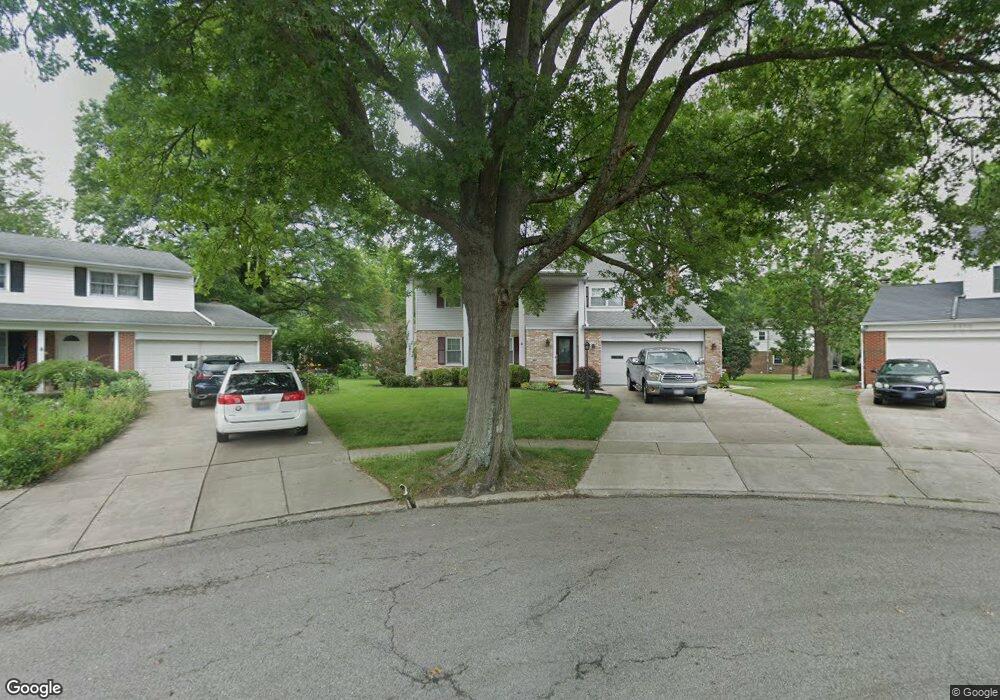
9523 Fallson Ct Blue Ash, OH 45242
Estimated Value: $533,887 - $601,000
4
Beds
3
Baths
2,056
Sq Ft
$278/Sq Ft
Est. Value
About This Home
This home is located at 9523 Fallson Ct, Blue Ash, OH 45242 and is currently estimated at $571,972, approximately $278 per square foot. 9523 Fallson Ct is a home located in Hamilton County with nearby schools including Edwin H Greene Intermediate Middle School, Sycamore Junior High School, and Sycamore High School.
Ownership History
Date
Name
Owned For
Owner Type
Purchase Details
Closed on
May 3, 2017
Sold by
Kelly Lawrence J
Bought by
Phillips John D
Current Estimated Value
Home Financials for this Owner
Home Financials are based on the most recent Mortgage that was taken out on this home.
Original Mortgage
$220,000
Outstanding Balance
$181,403
Interest Rate
4.14%
Mortgage Type
New Conventional
Estimated Equity
$390,569
Purchase Details
Closed on
Feb 27, 2003
Sold by
Jane Kelly Mary
Bought by
Kelly Mary J and The Mary J Kelly Trust
Create a Home Valuation Report for This Property
The Home Valuation Report is an in-depth analysis detailing your home's value as well as a comparison with similar homes in the area
Home Values in the Area
Average Home Value in this Area
Purchase History
| Date | Buyer | Sale Price | Title Company |
|---|---|---|---|
| Phillips John D | $275,000 | -- | |
| Kelly Mary J | -- | -- |
Source: Public Records
Mortgage History
| Date | Status | Borrower | Loan Amount |
|---|---|---|---|
| Open | Phillips John D | $220,000 |
Source: Public Records
Tax History
| Year | Tax Paid | Tax Assessment Tax Assessment Total Assessment is a certain percentage of the fair market value that is determined by local assessors to be the total taxable value of land and additions on the property. | Land | Improvement |
|---|---|---|---|---|
| 2025 | $5,572 | $128,433 | $26,530 | $101,903 |
| 2023 | $5,461 | $128,433 | $26,530 | $101,903 |
| 2022 | $5,413 | $105,876 | $20,675 | $85,201 |
| 2021 | $5,298 | $105,876 | $20,675 | $85,201 |
| 2020 | $5,340 | $105,876 | $20,675 | $85,201 |
| 2019 | $5,266 | $96,250 | $18,795 | $77,455 |
| 2018 | $5,040 | $96,250 | $18,795 | $77,455 |
| 2017 | $4,289 | $96,250 | $18,795 | $77,455 |
| 2016 | $3,811 | $83,969 | $18,753 | $65,216 |
| 2015 | $3,366 | $83,969 | $18,753 | $65,216 |
| 2014 | $3,379 | $83,969 | $18,753 | $65,216 |
| 2013 | $2,999 | $73,658 | $16,450 | $57,208 |
Source: Public Records
Map
Nearby Homes
- 9321 Hunters Creek Dr
- 4539 Leslie Ave
- 9216 Grandview Ave
- 4824 Fairview Ave
- 9870 Timbers Dr
- 4833 Fairview Ave
- 9348 Towne Square Ave
- 4722 Alpine Ave
- 4736 Alpine Ave
- 9966 Timbers Dr
- 4648 Belleview Ave
- 4737 Alpine Ave
- 9689 Cooper Ln
- 4152 Larchview Dr
- 9299 Fidelis Dr
- 9736 Cooper Ln
- 4557 Elizabeth Place
- 4230 Parkview Dr
- 4232 Parkview Dr
- 4234 Parkview Dr
- 9517 Fallson Ct
- 9530 Fallson Ct
- 9520 Raven Ln
- 4465 Boardwalk Ct
- 9512 Raven Ln
- 4459 Boardwalk Ct
- 4471 Boardwalk Ct
- 9509 Fallson Ct
- 9522 Fallson Ct
- 9506 Raven Ln
- 9528 Raven Ln
- 9516 Fallson Ct
- 4477 Boardwalk Ct
- 9503 Fallson Ct
- 9508 Fallson Ct
- 9500 Raven Ln
- 9519 Raven Ln
- 9502 Fallson Ct
- 9513 Raven Ln
- 9495 Fallson Ct
Your Personal Tour Guide
Ask me questions while you tour the home.