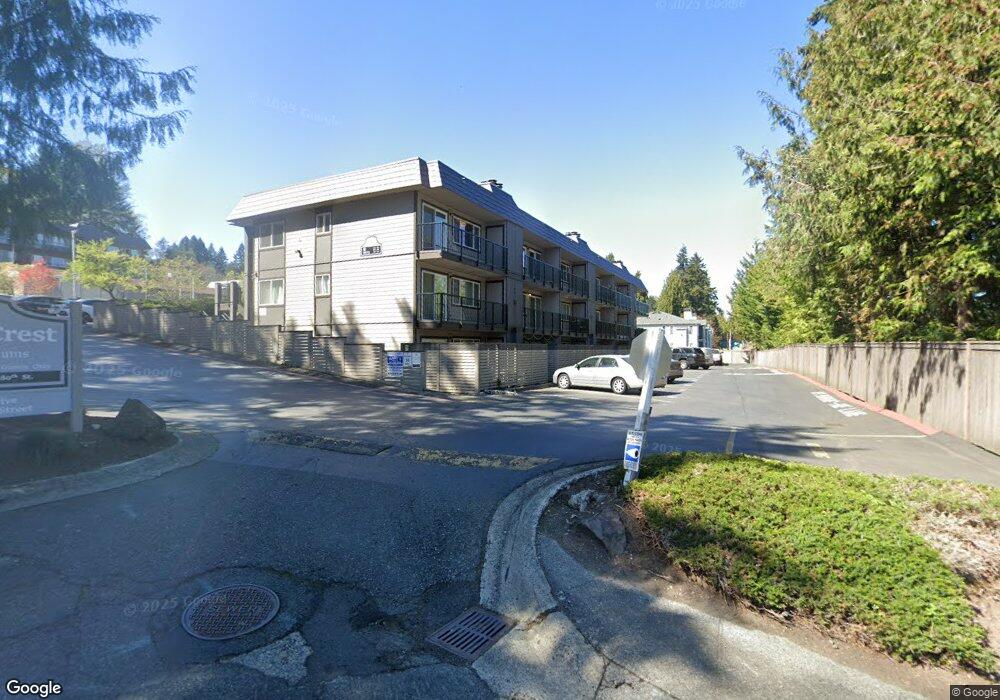
9523 NE 180th St Unit A201 Bothell, WA 98011
Downtown Bothell NeighborhoodEstimated Value: $282,000 - $338,000
1
Bed
1
Bath
865
Sq Ft
$364/Sq Ft
Est. Value
About This Home
This home is located at 9523 NE 180th St Unit A201, Bothell, WA 98011 and is currently estimated at $315,171, approximately $364 per square foot. 9523 NE 180th St Unit A201 is a home located in King County with nearby schools including Westhill Elementary School, Canyon Park Junior High School, and Bothell High School.
Ownership History
Date
Name
Owned For
Owner Type
Purchase Details
Closed on
Apr 21, 2003
Sold by
Chikos Marianne M
Bought by
Fleagle Laura
Current Estimated Value
Home Financials for this Owner
Home Financials are based on the most recent Mortgage that was taken out on this home.
Original Mortgage
$65,600
Outstanding Balance
$27,746
Interest Rate
5.54%
Estimated Equity
$287,425
Purchase Details
Closed on
Feb 25, 2000
Sold by
Franson Frederick T and Franson Dana K S
Bought by
Chikos Marianne M
Home Financials for this Owner
Home Financials are based on the most recent Mortgage that was taken out on this home.
Original Mortgage
$77,631
Interest Rate
8.16%
Purchase Details
Closed on
May 17, 1994
Sold by
Attri Surinder Paul
Bought by
Franson Frederick T and Franson Dana K S
Home Financials for this Owner
Home Financials are based on the most recent Mortgage that was taken out on this home.
Original Mortgage
$48,150
Interest Rate
8.52%
Create a Home Valuation Report for This Property
The Home Valuation Report is an in-depth analysis detailing your home's value as well as a comparison with similar homes in the area
Home Values in the Area
Average Home Value in this Area
Purchase History
| Date | Buyer | Sale Price | Title Company |
|---|---|---|---|
| Fleagle Laura | $82,000 | Pacific Nw Tit | |
| Chikos Marianne M | $79,500 | First American | |
| Franson Frederick T | $53,500 | First American Title |
Source: Public Records
Mortgage History
| Date | Status | Borrower | Loan Amount |
|---|---|---|---|
| Open | Fleagle Laura | $65,600 | |
| Previous Owner | Chikos Marianne M | $77,631 | |
| Previous Owner | Franson Frederick T | $48,150 |
Source: Public Records
Tax History Compared to Growth
Tax History
| Year | Tax Paid | Tax Assessment Tax Assessment Total Assessment is a certain percentage of the fair market value that is determined by local assessors to be the total taxable value of land and additions on the property. | Land | Improvement |
|---|---|---|---|---|
| 2024 | $3,011 | $314,000 | $126,600 | $187,400 |
| 2023 | $2,450 | $311,000 | $79,100 | $231,900 |
| 2022 | $2,693 | $274,000 | $70,300 | $203,700 |
| 2021 | $2,657 | $247,000 | $61,500 | $185,500 |
| 2020 | $2,524 | $225,000 | $61,500 | $163,500 |
| 2018 | $1,195 | $127,000 | $43,900 | $83,100 |
| 2017 | $988 | $100,000 | $37,800 | $62,200 |
| 2016 | $947 | $82,000 | $35,100 | $46,900 |
| 2015 | $1,081 | $80,000 | $31,600 | $48,400 |
| 2014 | -- | $90,000 | $31,600 | $58,400 |
| 2013 | -- | $83,000 | $31,600 | $51,400 |
Source: Public Records
Map
Nearby Homes
- 9517 NE 180th St Unit B-103
- 9604 Main St Unit C
- 17432 Bothell Way NE Unit B106
- 9608 NE 182nd Ct Unit D
- 17426 Bothell Way NE Unit A204
- 17426 Bothell Way NE Unit A407
- 9721 NE 183rd St Unit A
- 17338 Bothell Way NE Unit E
- 17209 W Riverside Dr
- 20341 90th Dr NE Unit F
- 18616 92nd Ave NE
- 10120 NE 185th St Unit A
- 10120 NE 185th St Unit B
- 10120 NE 185th St
- 10120 NE 185th St Unit C
- 10120 NE 185th St Unit D
- 9608 NE 188th St
- 8922 NE 173rd Place Unit A
- 18805 99th Ct NE Unit E
- 8904 NE 173rd Place Unit A
- 9523 NE 180th St
- 9523 NE 180th St Unit A303
- 9523 NE 180th St Unit A307
- 9523 NE 180th St Unit A106
- 9523 NE 180th St Unit A205
- 9523 NE 180th St Unit A203
- 9523 NE 180th St Unit A304
- 9523 NE 180th St Unit A204
- 9523 NE 180th St Unit A202
- 9523 NE 180th St Unit A306
- 9523 NE 180th St Unit A305
- 9523 NE 180th St Unit C306
- 9523 NE 180th St Unit A105
- 9523 NE 180th St Unit A302
- 9523 NE 180th St Unit C105
- 9523 NE 180th St Unit C207
- 9523 NE 180th St Unit A101
- 9523 NE 180th St Unit C202
- 9523 NE 180th St Unit B206
- 9523 NE 180th St Unit B306