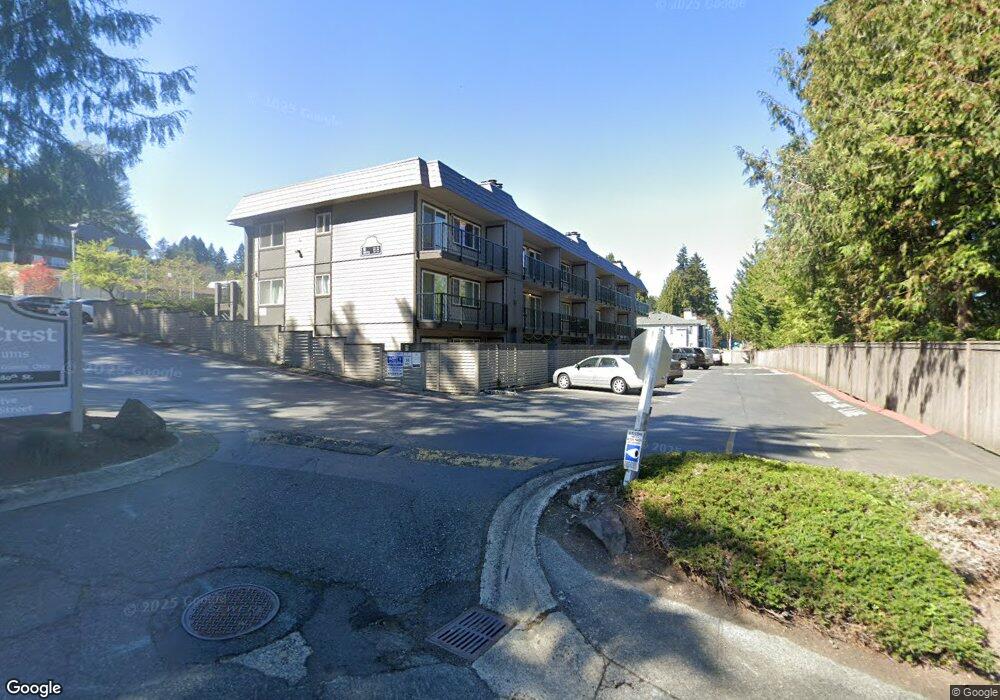
9523 NE 180th St Unit B206 Bothell, WA 98011
Downtown Bothell NeighborhoodEstimated Value: $256,119 - $281,000
1
Bed
1
Bath
730
Sq Ft
$365/Sq Ft
Est. Value
About This Home
This home is located at 9523 NE 180th St Unit B206, Bothell, WA 98011 and is currently estimated at $266,780, approximately $365 per square foot. 9523 NE 180th St Unit B206 is a home located in King County with nearby schools including Westhill Elementary School, Canyon Park Junior High School, and Bothell High School.
Ownership History
Date
Name
Owned For
Owner Type
Purchase Details
Closed on
Jan 22, 2021
Sold by
Walsh David E
Bought by
Agah Farzaneh and Shahidiyazdi Elham
Current Estimated Value
Home Financials for this Owner
Home Financials are based on the most recent Mortgage that was taken out on this home.
Original Mortgage
$180,000
Outstanding Balance
$160,338
Interest Rate
2.6%
Mortgage Type
New Conventional
Estimated Equity
$106,442
Purchase Details
Closed on
Apr 18, 2003
Sold by
Benardout Robert Isaac and Benardout Susan R
Bought by
Walsh David E
Home Financials for this Owner
Home Financials are based on the most recent Mortgage that was taken out on this home.
Original Mortgage
$77,551
Interest Rate
5.54%
Purchase Details
Closed on
Oct 23, 2000
Sold by
Benardout Robert I
Bought by
Benardout Robert I and Benardout Susan R
Create a Home Valuation Report for This Property
The Home Valuation Report is an in-depth analysis detailing your home's value as well as a comparison with similar homes in the area
Home Values in the Area
Average Home Value in this Area
Purchase History
| Date | Buyer | Sale Price | Title Company |
|---|---|---|---|
| Agah Farzaneh | $225,000 | First American Title | |
| Walsh David E | $79,950 | Old Republic T | |
| Benardout Robert I | -- | Chicago Title Insurance Co |
Source: Public Records
Mortgage History
| Date | Status | Borrower | Loan Amount |
|---|---|---|---|
| Open | Agah Farzaneh | $180,000 | |
| Previous Owner | Walsh David E | $77,551 |
Source: Public Records
Tax History
| Year | Tax Paid | Tax Assessment Tax Assessment Total Assessment is a certain percentage of the fair market value that is determined by local assessors to be the total taxable value of land and additions on the property. | Land | Improvement |
|---|---|---|---|---|
| 2024 | $2,654 | $275,000 | $106,800 | $168,200 |
| 2023 | $2,178 | $274,000 | $66,700 | $207,300 |
| 2022 | $2,432 | $242,000 | $59,300 | $182,700 |
| 2021 | $2,374 | $222,000 | $51,900 | $170,100 |
| 2020 | $2,256 | $200,000 | $51,900 | $148,100 |
| 2018 | $1,063 | $111,000 | $37,100 | $73,900 |
| 2017 | $879 | $88,000 | $31,900 | $56,100 |
| 2016 | $839 | $72,000 | $29,600 | $42,400 |
| 2015 | $959 | $70,000 | $26,700 | $43,300 |
| 2014 | -- | $79,000 | $26,700 | $52,300 |
| 2013 | -- | $71,000 | $26,700 | $44,300 |
Source: Public Records
Map
Nearby Homes
- 9515 NE 180th St Unit C101
- 9517 NE 180th St Unit B203
- 17432 Bothell Way NE Unit B108
- 17432 Bothell Way NE Unit B106
- 17426 Bothell Way NE Unit A407
- 17338 Bothell Way NE Unit E
- 9614 NE 183rd St Unit D
- 9632 NE 183rd St Unit B
- 9207 NE 175th St Unit A
- 9207 NE 175th St Unit B
- 17209 W Riverside Dr
- 8833 NE 178th St
- 18634 92nd Ave NE
- 18635 101st Ave NE Unit 6
- 18805 99th Ct NE Unit C
- 18805 99th Ct NE Unit D
- 18805 99th Ct NE Unit E
- 18808 NE 99th Ct NE Unit C
- 18809 99th Place NE Unit C
- 18809 99th Place NE Unit B
- 9523 NE 180th St
- 9523 NE 180th St Unit A303
- 9523 NE 180th St Unit A307
- 9523 NE 180th St Unit A106
- 9523 NE 180th St Unit A205
- 9523 NE 180th St Unit A203
- 9523 NE 180th St Unit A304
- 9523 NE 180th St Unit A204
- 9523 NE 180th St Unit A202
- 9523 NE 180th St Unit A306
- 9523 NE 180th St Unit A305
- 9523 NE 180th St Unit C306
- 9523 NE 180th St Unit A105
- 9523 NE 180th St Unit A302
- 9523 NE 180th St Unit C105
- 9523 NE 180th St Unit C207
- 9523 NE 180th St Unit A101
- 9523 NE 180th St Unit C202
- 9523 NE 180th St Unit A201
- 9523 NE 180th St Unit B306
Your Personal Tour Guide
Ask me questions while you tour the home.