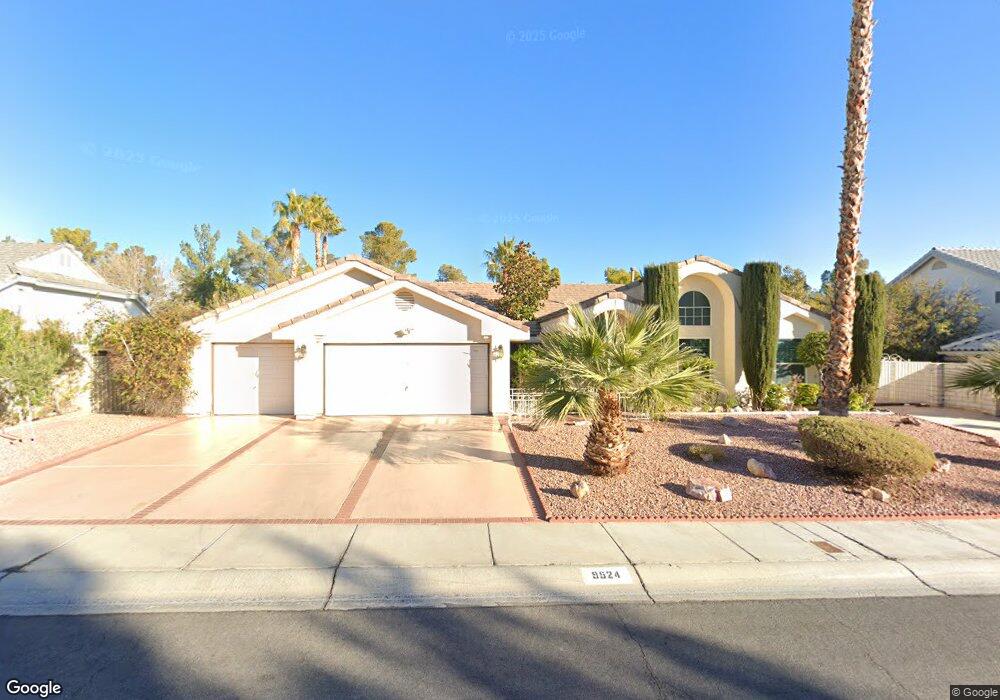
9524 Coral Way Las Vegas, NV 89117
The Section Seven NeighborhoodEstimated Value: $672,101 - $773,000
3
Beds
3
Baths
2,431
Sq Ft
$301/Sq Ft
Est. Value
About This Home
This home is located at 9524 Coral Way, Las Vegas, NV 89117 and is currently estimated at $732,275, approximately $301 per square foot. 9524 Coral Way is a home located in Clark County with nearby schools including M J Christensen Elementary School, Clifford J Lawrence Junior High School, and Bonanza High School.
Ownership History
Date
Name
Owned For
Owner Type
Purchase Details
Closed on
Jun 4, 2019
Sold by
Ilardo Angela Lila
Bought by
Ilardo Angela Lila and Hahn Julie
Current Estimated Value
Purchase Details
Closed on
Jul 19, 2018
Sold by
Ilardo Angel R and Ilardo Angela L
Bought by
Ilardo Angel Roberto and Ilardo Angela Lila
Purchase Details
Closed on
Oct 17, 2000
Sold by
Jones Calvin L
Bought by
Ilardo Angel R and Ilardo Angela L
Home Financials for this Owner
Home Financials are based on the most recent Mortgage that was taken out on this home.
Original Mortgage
$125,000
Outstanding Balance
$45,456
Interest Rate
7.88%
Mortgage Type
Stand Alone First
Estimated Equity
$686,819
Purchase Details
Closed on
Aug 4, 2000
Sold by
Swt & E Inc
Bought by
Jones Calvin L
Purchase Details
Closed on
Aug 20, 1996
Sold by
Jones Sherian Dee
Bought by
Jones Calvin Lester
Create a Home Valuation Report for This Property
The Home Valuation Report is an in-depth analysis detailing your home's value as well as a comparison with similar homes in the area
Home Values in the Area
Average Home Value in this Area
Purchase History
| Date | Buyer | Sale Price | Title Company |
|---|---|---|---|
| Ilardo Angela Lila | -- | None Available | |
| Ilardo Angel Roberto | -- | None Available | |
| Ilardo Angel R | $250,000 | Fidelity National Title | |
| Jones Calvin L | $35,938 | United Title | |
| Jones Calvin Lester | -- | National Title Company |
Source: Public Records
Mortgage History
| Date | Status | Borrower | Loan Amount |
|---|---|---|---|
| Open | Ilardo Angel R | $125,000 |
Source: Public Records
Tax History Compared to Growth
Tax History
| Year | Tax Paid | Tax Assessment Tax Assessment Total Assessment is a certain percentage of the fair market value that is determined by local assessors to be the total taxable value of land and additions on the property. | Land | Improvement |
|---|---|---|---|---|
| 2025 | $3,270 | $163,019 | $75,950 | $87,069 |
| 2024 | $3,175 | $163,019 | $75,950 | $87,069 |
| 2023 | $3,175 | $146,173 | $62,300 | $83,873 |
| 2022 | $3,083 | $133,226 | $55,650 | $77,576 |
| 2021 | $2,993 | $120,773 | $46,200 | $74,573 |
| 2020 | $2,903 | $118,735 | $44,100 | $74,635 |
| 2019 | $2,818 | $112,676 | $38,500 | $74,176 |
| 2018 | $2,736 | $111,937 | $39,900 | $72,037 |
| 2017 | $3,525 | $107,500 | $33,950 | $73,550 |
| 2016 | $2,561 | $97,969 | $23,800 | $74,169 |
| 2015 | $2,556 | $85,687 | $23,800 | $61,887 |
| 2014 | $2,481 | $73,734 | $14,000 | $59,734 |
Source: Public Records
Map
Nearby Homes
- 9544 Lazy River Dr
- 2728 Monrovia Dr
- 2724 Monrovia Dr
- 9708 Blazing Star Ct
- 2701 Purtell Cir
- 9724 Cascade Falls Ave
- 9713 Cascade Falls Ave
- 9429 Abalone Way
- 3001 Bridge Creek St
- 9605 Blowing Sand Cir
- 2300 Storkspur Way
- 2913 Domino Way
- 9624 Beach Water Cir
- 9548 Wooden Pier Way
- 2821 Willow Wind Ct
- 3009 Periscope Ct
- 9717 Sierra Mesa Ave
- 2712 Quail Roost Way
- 9504 Cliff View Way
- 9113 Anchor Cove Ct
- 9520 Coral Way
- 9600 Coral Way
- 9521 Coral Way
- 9516 Coral Way
- 9604 Coral Way
- 9517 Coral Way
- 9601 Coral Way
- 9545 Lazy River Dr
- 9541 Lazy River Dr
- 9601 Lazy River Dr
- 9537 Lazy River Dr
- 9605 Lazy River Dr
- 9513 Coral Way
- 9533 Lazy River Dr
- 9605 Coral Way
- 9512 Coral Way
- 9609 Lazy River Dr
- 9516 Treasure Beach Ct
- 9529 Lazy River Dr
- 9608 Coral Way