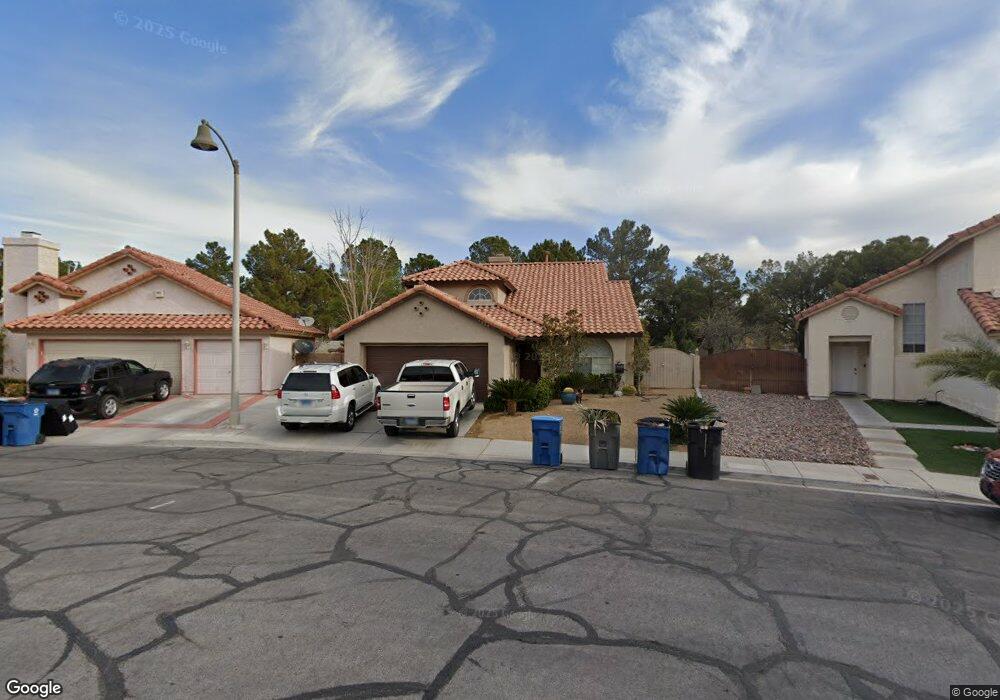
9524 Shallow Brook Cir Las Vegas, NV 89117
The Section Seven NeighborhoodEstimated Value: $509,000 - $543,000
3
Beds
3
Baths
1,797
Sq Ft
$291/Sq Ft
Est. Value
About This Home
This home is located at 9524 Shallow Brook Cir, Las Vegas, NV 89117 and is currently estimated at $522,029, approximately $290 per square foot. 9524 Shallow Brook Cir is a home located in Clark County with nearby schools including M J Christensen Elementary School, Clifford J Lawrence Junior High School, and Bonanza High School.
Ownership History
Date
Name
Owned For
Owner Type
Purchase Details
Closed on
Jul 17, 2013
Sold by
Solcher Steven J
Bought by
Spriggs Randall and Brown Carol J
Current Estimated Value
Home Financials for this Owner
Home Financials are based on the most recent Mortgage that was taken out on this home.
Original Mortgage
$211,105
Outstanding Balance
$155,624
Interest Rate
4.25%
Mortgage Type
FHA
Estimated Equity
$366,405
Purchase Details
Closed on
Sep 26, 2002
Sold by
Robbins Douglas and Robbins Lucretia
Bought by
Solcher Steven J
Home Financials for this Owner
Home Financials are based on the most recent Mortgage that was taken out on this home.
Original Mortgage
$152,000
Interest Rate
6.16%
Purchase Details
Closed on
Jul 12, 1995
Sold by
Cawley Robert M and Cawley Winters Rena
Bought by
Robbins Douglas and Robbins Lucretia
Home Financials for this Owner
Home Financials are based on the most recent Mortgage that was taken out on this home.
Original Mortgage
$125,400
Interest Rate
7.59%
Create a Home Valuation Report for This Property
The Home Valuation Report is an in-depth analysis detailing your home's value as well as a comparison with similar homes in the area
Home Values in the Area
Average Home Value in this Area
Purchase History
| Date | Buyer | Sale Price | Title Company |
|---|---|---|---|
| Spriggs Randall | $215,000 | Fidelity National Title | |
| Solcher Steven J | $190,000 | First American Title Co | |
| Robbins Douglas | $132,000 | Nevada Title Company |
Source: Public Records
Mortgage History
| Date | Status | Borrower | Loan Amount |
|---|---|---|---|
| Open | Spriggs Randall | $211,105 | |
| Previous Owner | Solcher Steven J | $152,000 | |
| Previous Owner | Robbins Douglas | $125,400 |
Source: Public Records
Tax History Compared to Growth
Tax History
| Year | Tax Paid | Tax Assessment Tax Assessment Total Assessment is a certain percentage of the fair market value that is determined by local assessors to be the total taxable value of land and additions on the property. | Land | Improvement |
|---|---|---|---|---|
| 2025 | $2,621 | $109,375 | $41,965 | $67,410 |
| 2024 | $2,545 | $109,375 | $41,965 | $67,410 |
| 2023 | $2,545 | $99,403 | $35,035 | $64,368 |
| 2022 | $2,709 | $89,289 | $29,645 | $59,644 |
| 2021 | $2,509 | $86,574 | $29,645 | $56,929 |
| 2020 | $2,326 | $85,327 | $28,490 | $56,837 |
| 2019 | $2,180 | $81,410 | $25,025 | $56,385 |
| 2018 | $2,081 | $76,309 | $21,560 | $54,749 |
| 2017 | $2,480 | $75,637 | $19,635 | $56,002 |
| 2016 | $1,948 | $73,221 | $16,940 | $56,281 |
| 2015 | $1,943 | $59,401 | $12,320 | $47,081 |
| 2014 | $1,883 | $61,142 | $7,700 | $53,442 |
Source: Public Records
Map
Nearby Homes
- 3213 Shallow Point Cir
- 9504 Cliff View Way
- 9548 Wooden Pier Way
- 9605 Blowing Sand Cir
- 9624 Beach Water Cir
- 3044 Forest Lake St
- 9312 Angelfish Dr
- 9305 Alameda Harbor Ave
- 3009 Periscope Ct
- 9333 Dry Dock Dr
- 9717 Sierra Mesa Ave
- 3220 Ventana Hills Dr
- 3381 Biscayne Bay Dr
- 3340 Shallow Pond Dr
- 3040 Ocean Port Dr
- 9651 Stoney Creek Dr
- 9713 Cascade Falls Ave
- 3205 Bermuda Bay St
- 9741 Horizon Hills Dr
- 3332 Ventana Hills Dr
- 9520 Shallow Brook Cir
- 9520 Shallow Brook
- 9528 Shallow Brook Cir
- 9528 Shallow Brook
- 9516 Shallow Brook Cir
- 9532 Shallow Brook Cir
- 9525 Shallow Brook Cir
- 9525 Shallow Brook
- 9533 Shallow Brook Cir
- 9517 Cliff View Way
- 9521 Cliff View Way
- 9529 Shallow Brook
- 9529 Shallow Brook Unit 9529
- 9524 Pacific View Dr
- 9504 Trident Cir
- 9525 Cliff View Way
- 9508 Trident Cir
- 9528 Pacific View Dr
- 3204 Shallow Point Cir
- 3200 Shallow Point Cir