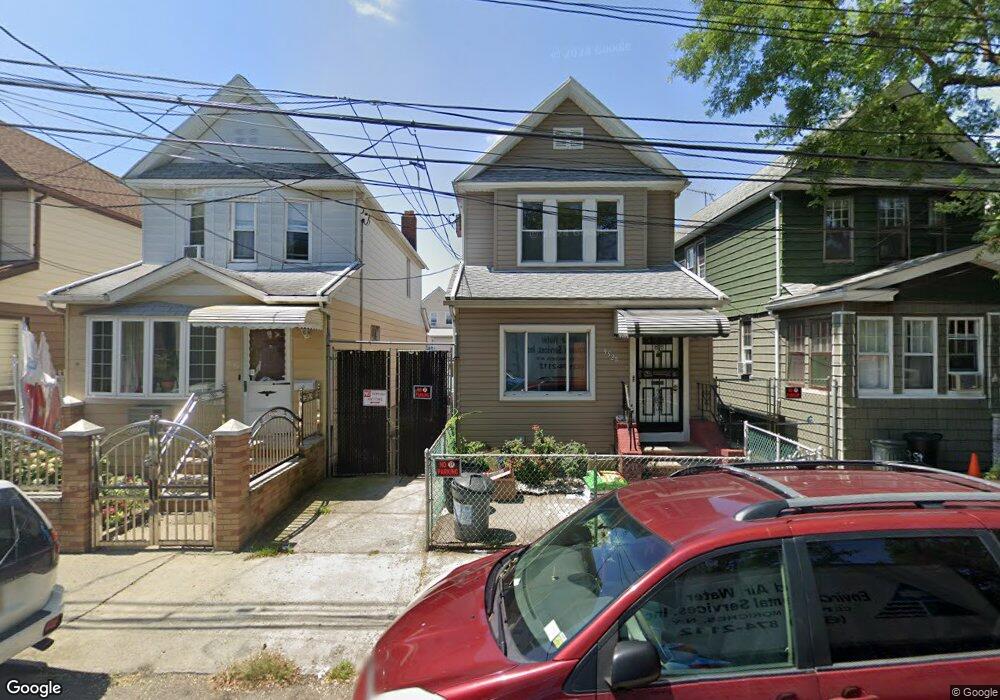
9528 82nd St Ozone Park, NY 11416
Ozone Park NeighborhoodEstimated Value: $696,000 - $812,000
3
Beds
3
Baths
1,356
Sq Ft
$573/Sq Ft
Est. Value
About This Home
This home is located at 9528 82nd St, Ozone Park, NY 11416 and is currently estimated at $777,201, approximately $573 per square foot. 9528 82nd St is a home located in Queens County with nearby schools including P.S. 64 - Joseph P. Addabbo, Santiam Elementary School, and Jhs 210 Elizabeth Blackwell.
Ownership History
Date
Name
Owned For
Owner Type
Purchase Details
Closed on
Jul 6, 2018
Sold by
Mozdean Doreen
Bought by
Bose Nandini and Dey Biswajit
Current Estimated Value
Home Financials for this Owner
Home Financials are based on the most recent Mortgage that was taken out on this home.
Original Mortgage
$512,000
Outstanding Balance
$441,860
Interest Rate
4.5%
Mortgage Type
New Conventional
Estimated Equity
$335,341
Purchase Details
Closed on
Jan 17, 2004
Sold by
Mozdean As Executor Doreen and The Estate Of Patricia Campbell
Bought by
Mozdean Doreen
Create a Home Valuation Report for This Property
The Home Valuation Report is an in-depth analysis detailing your home's value as well as a comparison with similar homes in the area
Home Values in the Area
Average Home Value in this Area
Purchase History
| Date | Buyer | Sale Price | Title Company |
|---|---|---|---|
| Bose Nandini | $640,000 | -- | |
| Bose Nandini | $640,000 | -- | |
| Mozdean Doreen | -- | -- | |
| Mozdean Doreen | -- | -- |
Source: Public Records
Mortgage History
| Date | Status | Borrower | Loan Amount |
|---|---|---|---|
| Open | Bose Nandini | $512,000 | |
| Closed | Bose Nandini | $512,000 |
Source: Public Records
Tax History Compared to Growth
Tax History
| Year | Tax Paid | Tax Assessment Tax Assessment Total Assessment is a certain percentage of the fair market value that is determined by local assessors to be the total taxable value of land and additions on the property. | Land | Improvement |
|---|---|---|---|---|
| 2025 | $5,785 | $30,526 | $7,559 | $22,967 |
| 2024 | $5,785 | $28,805 | $7,457 | $21,348 |
| 2023 | $5,785 | $28,805 | $7,516 | $21,289 |
| 2022 | $5,206 | $44,640 | $13,980 | $30,660 |
| 2021 | $5,374 | $40,740 | $13,980 | $26,760 |
| 2020 | $5,088 | $36,480 | $13,980 | $22,500 |
| 2019 | $4,729 | $32,940 | $13,980 | $18,960 |
| 2018 | $4,596 | $24,004 | $8,712 | $15,292 |
| 2017 | $4,374 | $22,929 | $9,986 | $12,943 |
| 2016 | $4,178 | $22,929 | $9,986 | $12,943 |
| 2015 | $2,389 | $21,198 | $11,486 | $9,712 |
| 2014 | $2,389 | $20,004 | $11,239 | $8,765 |
Source: Public Records
Map
Nearby Homes