
Landlord's Agent in 2024
Deb Wyckoff
Lentz Associates, Inc.
(440) 318-5000
6 in this area
93 Total Sales
Estimated Value: $173,891 - $224,000
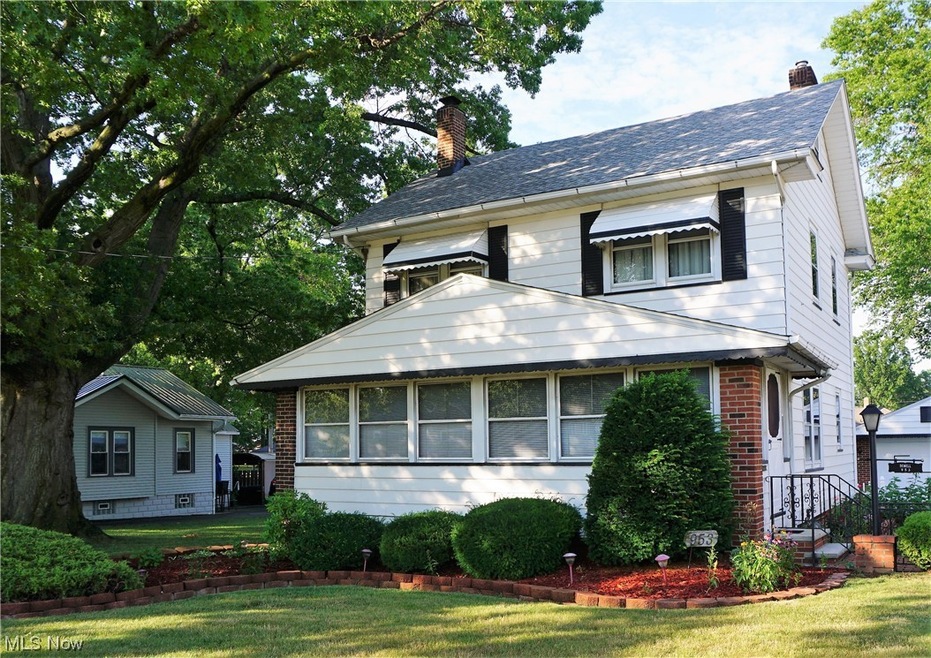
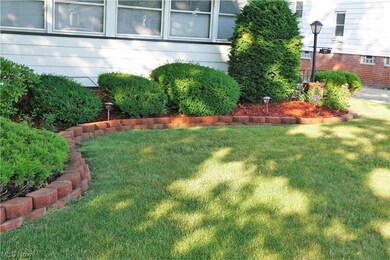
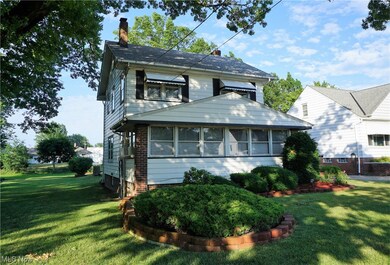
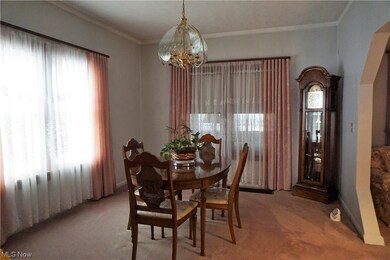
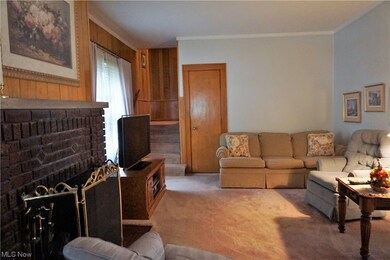
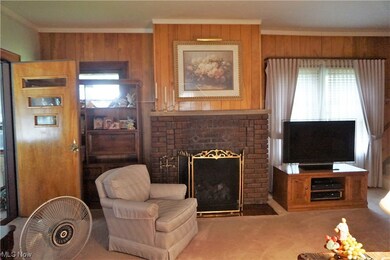
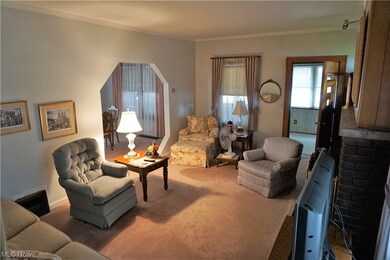
Time to move! Plenty of room in this great home. One step in the front door and enjoy the long 3 season room that can be opened up for fresh air. Then we travel in to the large living room with a gas fireplace for cozy evenings, the large formal dining room has plenty of space for your dining suite, and the kitchen with room for your table and chairs with a view of the lush back yard. The second floor features the 3 bedrooms and the full bath. The second full bath is in the basement. The 2 car garage also features an enclosed patio off the rear. Many updates have been done over the years with the most recent a roof that is only two years old. The home with its beautiful woodwork adds to the house the total feeling of “home”.
Last Agent to Rent the Property
Lentz Associates, Inc. Brokerage Email: 440-526-6300 admin@lentzhomes.com License #396966 Listed on: 02/15/2024
Co-Listed By
Berkshire Hathaway HomeServices Professional Realty Brokerage Email: 440-526-6300 admin@lentzhomes.com License #432462
Last Renter's Agent
Lentz Associates, Inc. Brokerage Email: 440-526-6300 admin@lentzhomes.com License #396966 Listed on: 02/15/2024
| Date | Buyer | Sale Price | Title Company |
|---|---|---|---|
| Sparta Apartments Llc | $100,000 | Dyer John J | |
| Demell Edith | -- | None Available | |
| Demell Edith | -- | -- |
| Date | Event | Price | List to Sale | Price per Sq Ft | Prior Sale |
|---|---|---|---|---|---|
| 05/06/2024 05/06/24 | Rented | $1,600 | 0.0% | -- | |
| 04/30/2024 04/30/24 | Under Contract | -- | -- | -- | |
| 03/23/2024 03/23/24 | Price Changed | $1,600 | -20.0% | $1 / Sq Ft | |
| 02/15/2024 02/15/24 | For Rent | $2,000 | 0.0% | -- | |
| 06/01/2022 06/01/22 | Sold | $100,000 | -15.6% | $62 / Sq Ft | View Prior Sale |
| 05/21/2022 05/21/22 | Pending | -- | -- | -- | |
| 04/12/2022 04/12/22 | Price Changed | $118,500 | -13.8% | $73 / Sq Ft | |
| 02/15/2022 02/15/22 | Price Changed | $137,500 | -1.7% | $85 / Sq Ft | |
| 12/20/2021 12/20/21 | Price Changed | $139,900 | -2.8% | $86 / Sq Ft | |
| 10/29/2021 10/29/21 | Price Changed | $144,000 | -0.6% | $89 / Sq Ft | |
| 09/17/2021 09/17/21 | Price Changed | $144,900 | -1.4% | $89 / Sq Ft | |
| 08/18/2021 08/18/21 | For Sale | $147,000 | 0.0% | $91 / Sq Ft | |
| 08/10/2021 08/10/21 | Pending | -- | -- | -- | |
| 07/29/2021 07/29/21 | Price Changed | $147,000 | -3.3% | $91 / Sq Ft | |
| 07/21/2021 07/21/21 | Price Changed | $152,000 | -3.2% | $94 / Sq Ft | |
| 06/28/2021 06/28/21 | For Sale | $157,000 | -- | $97 / Sq Ft |
| Year | Tax Paid | Tax Assessment Tax Assessment Total Assessment is a certain percentage of the fair market value that is determined by local assessors to be the total taxable value of land and additions on the property. | Land | Improvement |
|---|---|---|---|---|
| 2025 | -- | $82,270 | $14,160 | $68,110 |
| 2024 | -- | $82,270 | $14,160 | $68,110 |
| 2023 | $6,578 | $53,490 | $12,070 | $41,420 |
| 2022 | $3,916 | $53,490 | $12,070 | $41,420 |
| 2021 | $3,932 | $53,490 | $12,070 | $41,420 |
| 2020 | $3,791 | $43,840 | $9,890 | $33,950 |
| 2019 | $2,985 | $43,840 | $9,890 | $33,950 |
| 2018 | $2,581 | $45,220 | $16,870 | $28,350 |
| 2017 | $2,580 | $45,220 | $16,870 | $28,350 |
| 2016 | $2,567 | $45,220 | $16,870 | $28,350 |
| 2015 | $2,512 | $45,220 | $16,870 | $28,350 |
| 2014 | $2,213 | $45,220 | $16,870 | $28,350 |
| 2013 | $2,212 | $45,220 | $16,870 | $28,350 |
Landlord's Agent in 2024
Deb Wyckoff
Lentz Associates, Inc.
(440) 318-5000
6 in this area
93 Total Sales
Landlord's Co-Listing Agent in 2024
Diane Russo Armington
Berkshire Hathaway HomeServices Professional Realty
(440) 247-2224
2 in this area
120 Total Sales
Source: MLS Now
MLS Number: 5017771
APN: 29-A-002-G-00-002
Disclaimer: Certain information contained herein is derived from information provided by parties other than Homes.com. All information provided is deemed reliable, but is not guaranteed to be accurate and should be independently verified.
![]() IDX information is provided exclusively for personal, non-commercial use, and may not be used for any purpose other than to identify prospective properties consumers may be interested in purchasing. Information is deemed reliable but not guaranteed.
IDX information is provided exclusively for personal, non-commercial use, and may not be used for any purpose other than to identify prospective properties consumers may be interested in purchasing. Information is deemed reliable but not guaranteed.
Ask me questions while you tour the home.