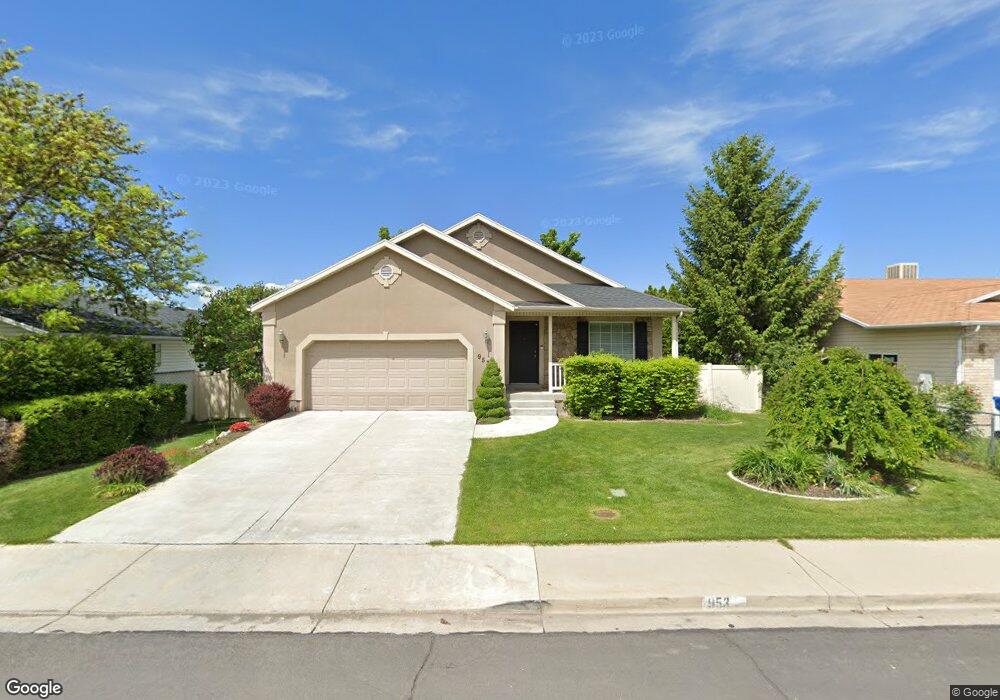
953 N Main St Unit 3 Orem, UT 84057
Windsor NeighborhoodEstimated Value: $548,000 - $591,000
3
Beds
3
Baths
1,329
Sq Ft
$435/Sq Ft
Est. Value
About This Home
This home is located at 953 N Main St Unit 3, Orem, UT 84057 and is currently estimated at $578,266, approximately $435 per square foot. 953 N Main St Unit 3 is a home located in Utah County with nearby schools including Windsor School, Canyon View Junior High School, and Timpanogos High School.
Ownership History
Date
Name
Owned For
Owner Type
Purchase Details
Closed on
Aug 4, 2015
Sold by
Nelson Dan A and Nelson Nuria I
Bought by
Asay Scott David
Current Estimated Value
Home Financials for this Owner
Home Financials are based on the most recent Mortgage that was taken out on this home.
Original Mortgage
$255,000
Outstanding Balance
$200,215
Interest Rate
3.98%
Mortgage Type
New Conventional
Estimated Equity
$378,051
Purchase Details
Closed on
Jun 17, 2003
Sold by
Patriot Homes Inc
Bought by
Nelson Dan A and Nelson Nuria I
Home Financials for this Owner
Home Financials are based on the most recent Mortgage that was taken out on this home.
Original Mortgage
$154,850
Interest Rate
5.53%
Mortgage Type
Purchase Money Mortgage
Purchase Details
Closed on
May 17, 2002
Sold by
Johnson Ray and Johnson Edyn
Bought by
Patriot Homes Inc
Create a Home Valuation Report for This Property
The Home Valuation Report is an in-depth analysis detailing your home's value as well as a comparison with similar homes in the area
Home Values in the Area
Average Home Value in this Area
Purchase History
| Date | Buyer | Sale Price | Title Company |
|---|---|---|---|
| Asay Scott David | -- | Morgan Title & Escrow Inc | |
| Nelson Dan A | -- | Affiliated First Title | |
| Patriot Homes Inc | -- | Metro National Title |
Source: Public Records
Mortgage History
| Date | Status | Borrower | Loan Amount |
|---|---|---|---|
| Open | Asay Scott David | $255,000 | |
| Previous Owner | Nelson Dan A | $154,850 |
Source: Public Records
Tax History Compared to Growth
Tax History
| Year | Tax Paid | Tax Assessment Tax Assessment Total Assessment is a certain percentage of the fair market value that is determined by local assessors to be the total taxable value of land and additions on the property. | Land | Improvement |
|---|---|---|---|---|
| 2025 | $2,323 | $295,130 | $220,300 | $316,300 |
| 2024 | $2,323 | $284,075 | $0 | $0 |
| 2023 | $2,176 | $286,000 | $0 | $0 |
| 2022 | $2,257 | $287,430 | $0 | $0 |
| 2021 | $1,963 | $378,600 | $131,600 | $247,000 |
| 2020 | $1,833 | $347,500 | $105,300 | $242,200 |
| 2019 | $1,603 | $316,000 | $95,400 | $220,600 |
| 2018 | $1,596 | $300,600 | $92,100 | $208,500 |
| 2017 | $1,540 | $155,375 | $0 | $0 |
| 2016 | $1,557 | $144,815 | $0 | $0 |
| 2015 | $1,529 | $134,530 | $0 | $0 |
| 2014 | $1,447 | $126,720 | $0 | $0 |
Source: Public Records
Map
Nearby Homes