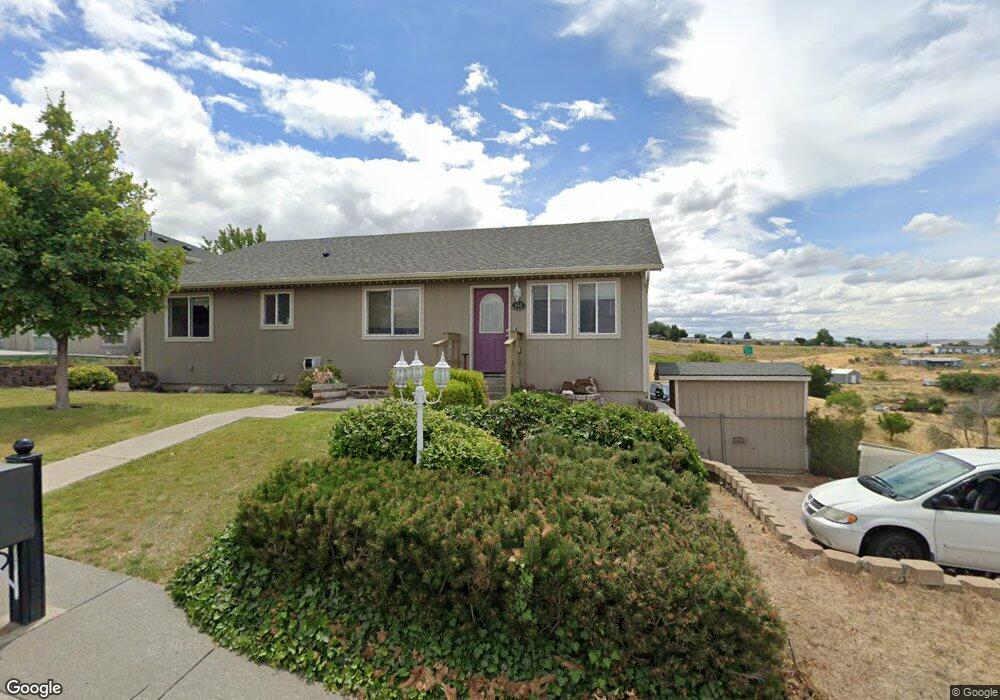
953 S Main St Pendleton, OR 97801
Estimated Value: $316,000 - $405,740
4
Beds
2
Baths
1,752
Sq Ft
$202/Sq Ft
Est. Value
About This Home
This home is located at 953 S Main St, Pendleton, OR 97801 and is currently estimated at $353,913, approximately $202 per square foot. 953 S Main St is a home located in Umatilla County with nearby schools including Sunridge Middle School, Pendleton High School, and Pendleton Christian School.
Ownership History
Date
Name
Owned For
Owner Type
Purchase Details
Closed on
Oct 4, 2021
Sold by
Hardcastle Jeffrey Scott
Bought by
Deem Jason L and Deem Sarah E
Current Estimated Value
Home Financials for this Owner
Home Financials are based on the most recent Mortgage that was taken out on this home.
Original Mortgage
$239,200
Outstanding Balance
$218,128
Interest Rate
2.8%
Mortgage Type
VA
Estimated Equity
$135,785
Purchase Details
Closed on
Jan 26, 2011
Sold by
Hardcastle Jeffrey Scott and Hardcastle Terri L
Bought by
Hardcastle Jeffrey Scott
Create a Home Valuation Report for This Property
The Home Valuation Report is an in-depth analysis detailing your home's value as well as a comparison with similar homes in the area
Home Values in the Area
Average Home Value in this Area
Purchase History
| Date | Buyer | Sale Price | Title Company |
|---|---|---|---|
| Deem Jason L | $239,200 | None Available | |
| Hardcastle Jeffrey Scott | -- | None Available |
Source: Public Records
Mortgage History
| Date | Status | Borrower | Loan Amount |
|---|---|---|---|
| Open | Deem Jason L | $239,200 |
Source: Public Records
Tax History
| Year | Tax Paid | Tax Assessment Tax Assessment Total Assessment is a certain percentage of the fair market value that is determined by local assessors to be the total taxable value of land and additions on the property. | Land | Improvement |
|---|---|---|---|---|
| 2022 | $4,259 | $235,470 | $0 | $0 |
| 2021 | $4,284 | $228,620 | $31,260 | $197,360 |
| 2020 | $4,138 | $221,970 | $30,350 | $191,620 |
| 2018 | $4,020 | $209,240 | $28,610 | $180,630 |
| 2017 | $3,924 | $203,150 | $27,770 | $175,380 |
| 2016 | $3,447 | $183,390 | $26,960 | $156,430 |
| 2015 | $3,449 | $167,840 | $24,680 | $143,160 |
| 2014 | $3,302 | $167,840 | $24,680 | $143,160 |
Source: Public Records
Map
Nearby Homes
- 922 S Main St
- 27 SE Kirk Place
- 606 SW 3rd St
- 611 SW 3rd St
- 607 SW 2nd St
- 606 SW 2nd St
- 615 SW 5th St
- 805 SE 6th St
- 415 SW 7th St
- 0 SW 9th St
- 0 Oregon 11
- 703 SE Isaac Ave
- 941 SE 9th St
- 524 SW 12th St
- 514 SW 13th St
- 612 SE Dorion Ave
- 1109 SW Nye Ave
- 401 NW Bailey Ave
- 1213 SW 17th Place
- 701 SE Court Ave
Your Personal Tour Guide
Ask me questions while you tour the home.