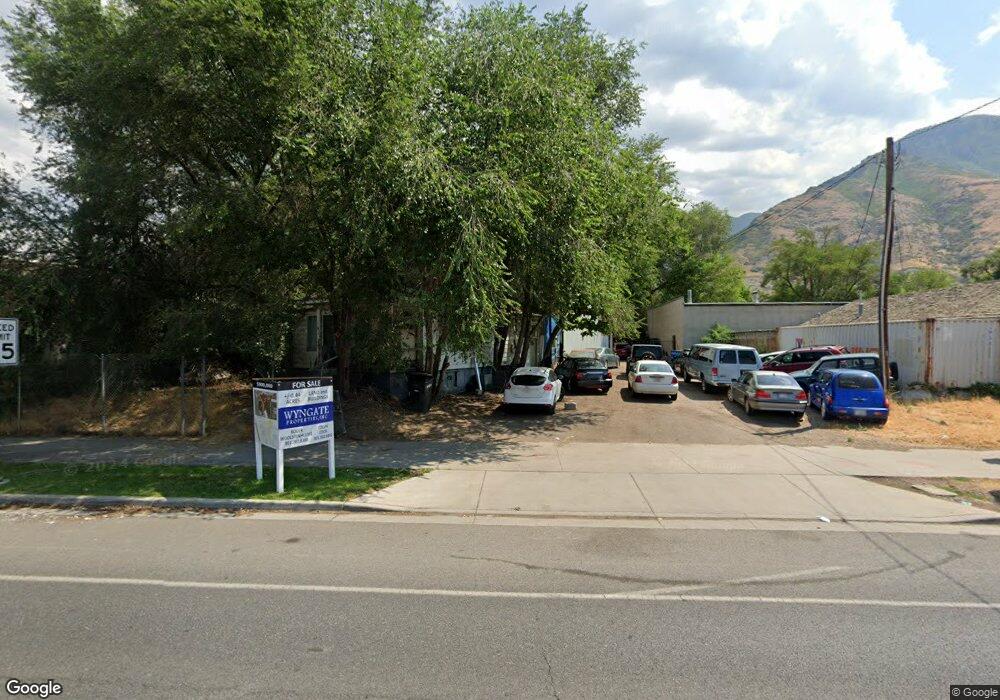
953 S State St Provo, UT 84606
Provost NeighborhoodEstimated Value: $300,000 - $467,000
1
Bed
1
Bath
4,163
Sq Ft
$96/Sq Ft
Est. Value
About This Home
This home is located at 953 S State St, Provo, UT 84606 and is currently estimated at $398,286, approximately $95 per square foot. 953 S State St is a home located in Utah County with nearby schools including Provost School, Centennial Middle School, and Timpview High School.
Ownership History
Date
Name
Owned For
Owner Type
Purchase Details
Closed on
Jul 26, 2024
Sold by
David Martin Pett Legacy Trust and Pett David Roy
Bought by
Avanesyan Roman
Current Estimated Value
Purchase Details
Closed on
May 22, 2013
Sold by
Pett David M
Bought by
Pett David Martin and David Martin Pett Legacy Trust
Purchase Details
Closed on
Dec 29, 2011
Sold by
Pett David M
Bought by
Utah Department Of Transportation
Purchase Details
Closed on
Aug 30, 2002
Sold by
Pett Loyal
Bought by
Pett David M
Create a Home Valuation Report for This Property
The Home Valuation Report is an in-depth analysis detailing your home's value as well as a comparison with similar homes in the area
Home Values in the Area
Average Home Value in this Area
Purchase History
| Date | Buyer | Sale Price | Title Company |
|---|---|---|---|
| Avanesyan Roman | -- | Backman Title | |
| Pett David Martin | -- | None Available | |
| Utah Department Of Transportation | -- | None Available | |
| Pett David M | -- | -- |
Source: Public Records
Tax History Compared to Growth
Tax History
| Year | Tax Paid | Tax Assessment Tax Assessment Total Assessment is a certain percentage of the fair market value that is determined by local assessors to be the total taxable value of land and additions on the property. | Land | Improvement |
|---|---|---|---|---|
| 2025 | $2,479 | $282,410 | $180,200 | $146,400 |
| 2024 | $2,479 | $243,975 | $0 | $0 |
| 2023 | $2,273 | $220,565 | $0 | $0 |
| 2022 | $2,232 | $262,400 | $121,500 | $140,900 |
| 2021 | $2,013 | $225,900 | $110,400 | $115,500 |
| 2020 | $2,147 | $225,900 | $110,400 | $115,500 |
| 2019 | $1,450 | $162,100 | $46,200 | $115,900 |
| 2018 | $1,253 | $141,300 | $44,000 | $97,300 |
| 2017 | $1,563 | $144,935 | $0 | $0 |
| 2016 | $1,510 | $151,180 | $0 | $0 |
| 2015 | $1,579 | $137,960 | $0 | $0 |
| 2014 | $1,501 | $134,025 | $0 | $0 |
Source: Public Records
Map
Nearby Homes
- 1332 Cinnamon Ridge Way
- 1156 S 1000 E
- 1184 S 1000 E
- 976 E 1230 S
- 1263 S 1000 E
- 1182 S 900 E
- 1296 S 1050 E
- 1154 S 1430 E
- 1417 E 700 S
- 1141 E 1320 S Unit B401
- 1243 E 520 S
- 1242 E 460 S
- 1460 E 520 S
- 914 S Aspen Cir Unit 49
- 943 E 420 S
- 1128 S Slate Canyon Dr
- 1454 E 1370 S
- 1052 Canyon Meadow Dr Unit 4
- 775 E 400 S
- 1145 Meadow Fork Rd Unit 4