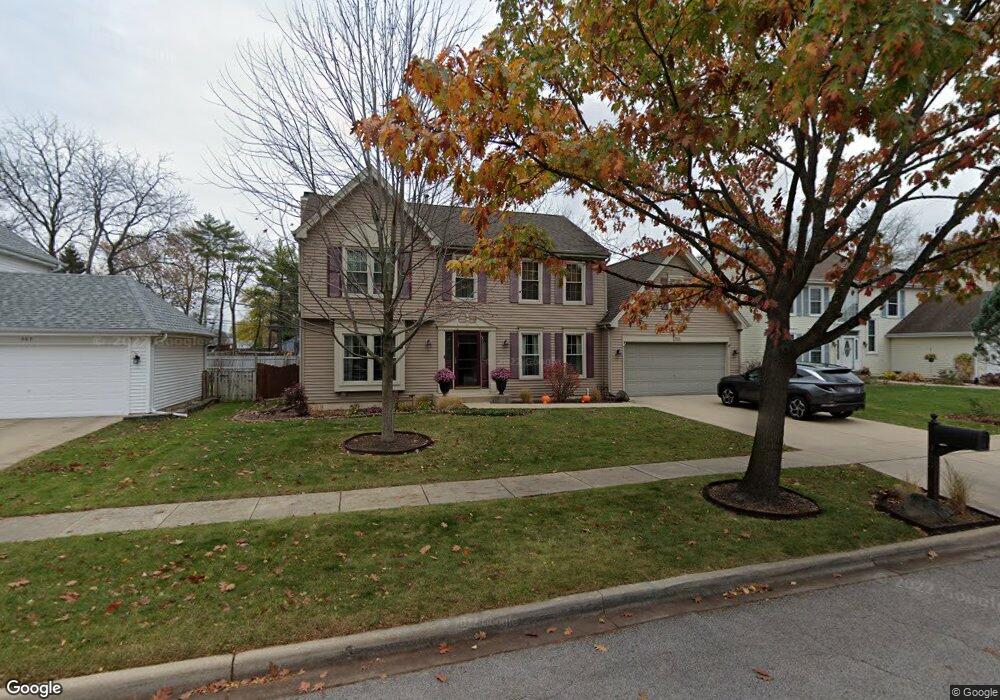
953 Wellington Cir Unit 2 Aurora, IL 60506
Edgelawn Randall NeighborhoodEstimated Value: $386,419 - $417,000
--
Bed
1
Bath
1,960
Sq Ft
$205/Sq Ft
Est. Value
About This Home
This home is located at 953 Wellington Cir Unit 2, Aurora, IL 60506 and is currently estimated at $402,105, approximately $205 per square foot. 953 Wellington Cir Unit 2 is a home located in Kane County with nearby schools including Hall Elementary School, Jefferson Middle School, and West Aurora High School.
Ownership History
Date
Name
Owned For
Owner Type
Purchase Details
Closed on
Nov 12, 2001
Sold by
Wood Gary and Wood Rose M
Bought by
Shields David R and Shields Tammy L
Current Estimated Value
Home Financials for this Owner
Home Financials are based on the most recent Mortgage that was taken out on this home.
Original Mortgage
$180,800
Outstanding Balance
$70,509
Interest Rate
6.69%
Estimated Equity
$331,596
Purchase Details
Closed on
Jun 28, 1995
Sold by
Merchants National Bank Of Aurora
Bought by
Wood Gary and Wood Rose M
Home Financials for this Owner
Home Financials are based on the most recent Mortgage that was taken out on this home.
Original Mortgage
$160,000
Interest Rate
7.56%
Create a Home Valuation Report for This Property
The Home Valuation Report is an in-depth analysis detailing your home's value as well as a comparison with similar homes in the area
Home Values in the Area
Average Home Value in this Area
Purchase History
| Date | Buyer | Sale Price | Title Company |
|---|---|---|---|
| Shields David R | $226,000 | First American Title Co | |
| Wood Gary | $180,000 | Chicago Title Insurance Co |
Source: Public Records
Mortgage History
| Date | Status | Borrower | Loan Amount |
|---|---|---|---|
| Open | Shields David R | $180,800 | |
| Previous Owner | Wood Gary | $160,000 |
Source: Public Records
Tax History Compared to Growth
Tax History
| Year | Tax Paid | Tax Assessment Tax Assessment Total Assessment is a certain percentage of the fair market value that is determined by local assessors to be the total taxable value of land and additions on the property. | Land | Improvement |
|---|---|---|---|---|
| 2024 | $8,646 | $117,196 | $21,211 | $95,985 |
| 2023 | $8,284 | $104,714 | $18,952 | $85,762 |
| 2022 | $7,926 | $95,542 | $17,292 | $78,250 |
| 2021 | $7,612 | $89,314 | $16,099 | $73,215 |
| 2020 | $7,205 | $82,960 | $14,954 | $68,006 |
| 2019 | $6,929 | $76,864 | $13,855 | $63,009 |
| 2018 | $6,995 | $76,069 | $12,816 | $63,253 |
| 2017 | $7,814 | $81,925 | $11,809 | $70,116 |
| 2016 | $7,003 | $71,918 | $10,123 | $61,795 |
| 2015 | -- | $62,796 | $8,705 | $54,091 |
| 2014 | -- | $58,601 | $8,372 | $50,229 |
| 2013 | -- | $57,767 | $8,253 | $49,514 |
Source: Public Records
Map
Nearby Homes
- 972 Westgate Dr
- 1390 N Glen Cir Unit B
- 833 N Randall Rd Unit C4
- 1389 Monomoy St Unit B2
- 1035 Newcastle Ln
- 1351 Monomoy St Unit D
- 1296 Yellowpine Dr
- 1149 Newcastle Ln
- 630 N Buell Ave
- 865 N Fordham Ave
- 1747 W Illinois Ave
- 1104 New Haven Ave
- 960 Sapphire Ln
- 964 Sapphire Ln
- 967 Sapphire Ln
- 959 Sapphire Ln
- 963 Sapphire Ln
- 1120 Emerald Dr
- 795 N Elmwood Dr
- 781 N Elmwood Dr
- 957 Wellington Cir Unit 2
- 949 Wellington Cir Unit 2
- 961 Wellington Cir
- 945 Wellington Cir
- 956 Wellington Cir Unit 2
- 960 Wellington Cir
- 930 N Randall Rd
- 941 Wellington Cir
- 965 Wellington Cir
- 924 N Randall Rd
- 932 Wellington Cir
- 964 Wellington Cir
- 936 N Randall Rd
- 948 Wellington Ct
- 914 N Randall Rd
- 968 Wellington Cir
- 969 Wellington Cir
- 928 Wellington Cir
- 944 Wellington Ct Unit 2
- 940 Wellington Ct