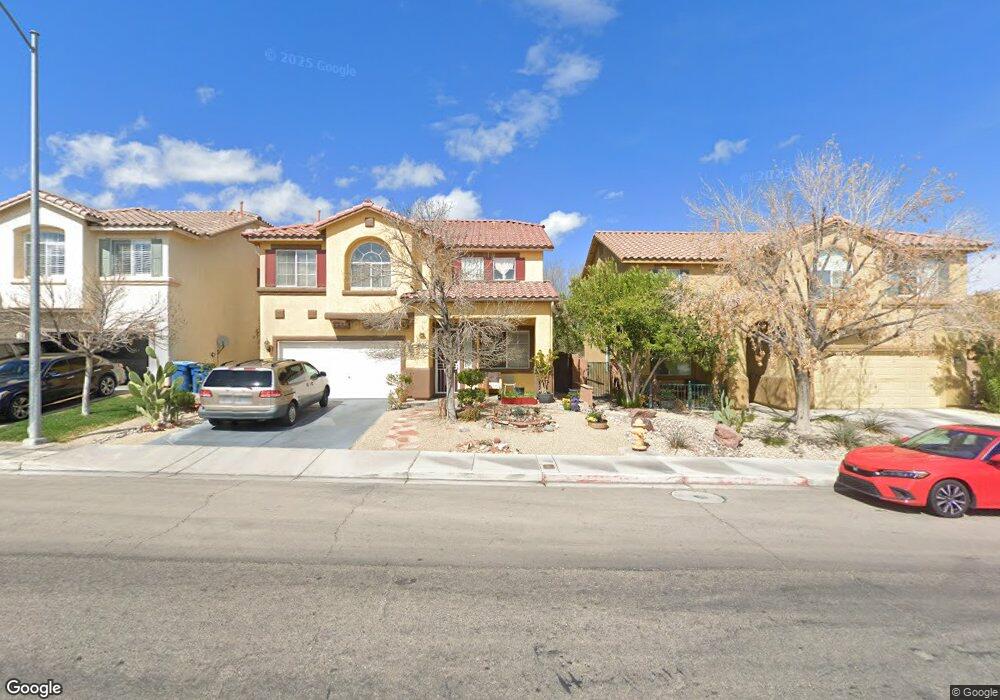
9530 W Mesa Vista Ave Unit 2 Las Vegas, NV 89148
Estimated Value: $509,645 - $550,000
4
Beds
3
Baths
2,390
Sq Ft
$221/Sq Ft
Est. Value
About This Home
This home is located at 9530 W Mesa Vista Ave Unit 2, Las Vegas, NV 89148 and is currently estimated at $528,911, approximately $221 per square foot. 9530 W Mesa Vista Ave Unit 2 is a home located in Clark County with nearby schools including Kathy L. Batterman Elementary School, Victoria Fertitta Middle School, and Durango High School.
Ownership History
Date
Name
Owned For
Owner Type
Purchase Details
Closed on
Dec 16, 2010
Sold by
Ou Chi Wing
Bought by
Ou Chi Wing and Ou Ellen
Current Estimated Value
Purchase Details
Closed on
Nov 23, 2009
Sold by
Ou Chi Wing and Ou Ellen
Bought by
Ou Chi Wing
Purchase Details
Closed on
Mar 31, 2003
Sold by
Aumentado Charina
Bought by
Ou Chi Wing and Ou Ellen Wen
Home Financials for this Owner
Home Financials are based on the most recent Mortgage that was taken out on this home.
Original Mortgage
$166,690
Outstanding Balance
$71,767
Interest Rate
5.78%
Estimated Equity
$457,144
Purchase Details
Closed on
Oct 27, 2000
Sold by
Jones Alastair A
Bought by
Aumentado Charina
Home Financials for this Owner
Home Financials are based on the most recent Mortgage that was taken out on this home.
Original Mortgage
$158,500
Interest Rate
7.89%
Create a Home Valuation Report for This Property
The Home Valuation Report is an in-depth analysis detailing your home's value as well as a comparison with similar homes in the area
Home Values in the Area
Average Home Value in this Area
Purchase History
| Date | Buyer | Sale Price | Title Company |
|---|---|---|---|
| Ou Chi Wing | -- | None Available | |
| Ou Chi Wing | -- | None Available | |
| Ou Chi Wing | $211,000 | Equity Title Of Nevada | |
| Aumentado Charina | $165,490 | First American Title Co | |
| Aumentado Charina | $167,527 | First American Title Co |
Source: Public Records
Mortgage History
| Date | Status | Borrower | Loan Amount |
|---|---|---|---|
| Open | Ou Chi Wing | $166,690 | |
| Previous Owner | Aumentado Charina | $158,500 |
Source: Public Records
Tax History Compared to Growth
Tax History
| Year | Tax Paid | Tax Assessment Tax Assessment Total Assessment is a certain percentage of the fair market value that is determined by local assessors to be the total taxable value of land and additions on the property. | Land | Improvement |
|---|---|---|---|---|
| 2025 | $2,235 | $124,277 | $43,050 | $81,227 |
| 2024 | $2,170 | $124,277 | $43,050 | $81,227 |
| 2023 | $2,170 | $110,518 | $33,600 | $76,918 |
| 2022 | $2,107 | $102,276 | $31,850 | $70,426 |
| 2021 | $2,046 | $96,510 | $29,750 | $66,760 |
| 2020 | $1,983 | $94,567 | $28,350 | $66,217 |
| 2019 | $1,925 | $90,356 | $24,850 | $65,506 |
| 2018 | $1,869 | $82,426 | $19,950 | $62,476 |
| 2017 | $2,400 | $81,841 | $18,550 | $63,291 |
| 2016 | $1,771 | $77,171 | $16,450 | $60,721 |
| 2015 | $1,767 | $74,262 | $11,900 | $62,362 |
| 2014 | $1,712 | $56,630 | $9,100 | $47,530 |
Source: Public Records
Map
Nearby Homes
- 9472 W Diablo Dr
- 9631 Tuscola Ct
- 9522 Arrowhead Falls Ct
- 9687 Ridgebluff Ave
- 5554 Chicory Falls Ct
- 9731 Cathedral Stairs Ct
- 9693 Bighorn Island Ave
- 9217 Valley Betica Ave
- 9750 Maple Sugar Leaf Place
- 9205 Valley Betica Ave
- 5548 Anshan St
- 9862 Shadow Grove Ave
- 9580 W Reno Ave Unit 261
- 9580 W Reno Ave Unit 240
- 9580 W Reno Ave Unit 233
- 9580 W Reno Ave Unit 238
- 5533 Sterling Valley Ct
- 5048 Orchid Springs St
- 9173 Verdugo Ridge Ct
- 5544 Jinsha River St
- 9536 W Mesa Vista Ave
- 9524 W Mesa Vista Ave
- 9542 W Mesa Vista Ave Unit 2
- 9518 W Mesa Vista Ave
- 9529 Scottville Ct
- 9535 Scottville Ct Unit n/a
- 9535 Scottville Ct
- 9523 Scottville Ct
- 9541 Scottville Ct
- 9548 W Mesa Vista Ave
- 9517 Scottville Ct
- 9512 W Mesa Vista Ave
- 9526 Creedmoor Ct
- 9532 Creedmoor Ct
- 9547 Scottville Ct
- 9538 Creedmoor Ct
- 9538 Creedmoor Ct Unit 9999
- 9554 W Mesa Vista Ave
- 9511 Scottville Ct
- 9506 W Mesa Vista Ave