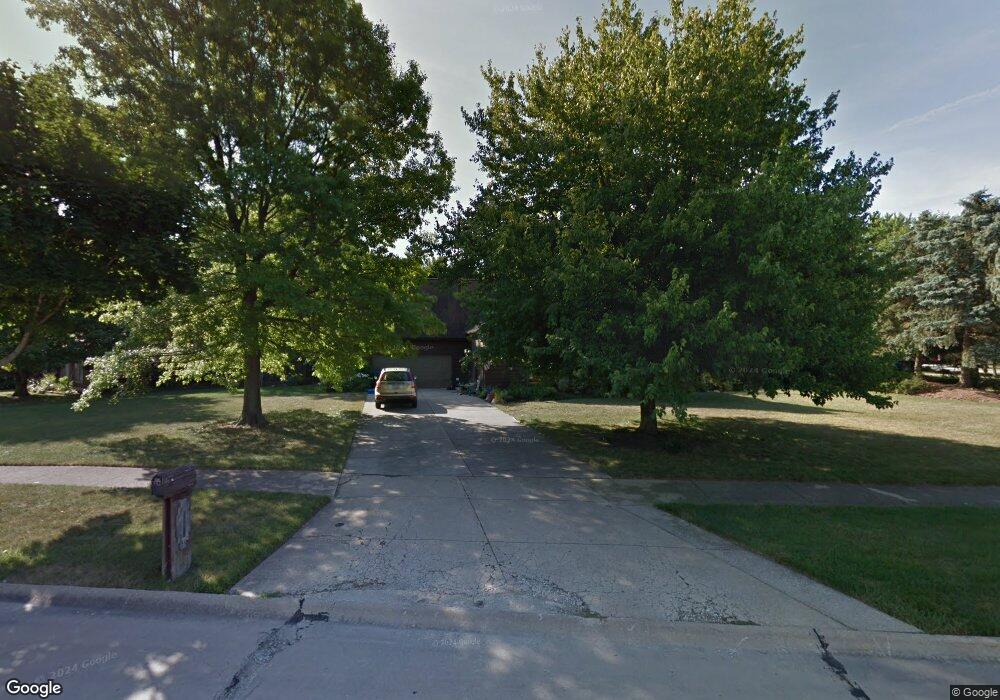
9537 Charney Cir Olmsted Falls, OH 44138
Estimated Value: $329,000 - $386,000
3
Beds
3
Baths
2,828
Sq Ft
$125/Sq Ft
Est. Value
About This Home
This home is located at 9537 Charney Cir, Olmsted Falls, OH 44138 and is currently estimated at $354,340, approximately $125 per square foot. 9537 Charney Cir is a home located in Cuyahoga County with nearby schools including Falls-Lenox Primary Elementary School, Olmsted Falls Intermediate Building, and Olmsted Falls Middle School.
Ownership History
Date
Name
Owned For
Owner Type
Purchase Details
Closed on
Dec 8, 2021
Sold by
Thompson Garry A and Thompson Christine M
Bought by
Garry A Thompson And Christine M Thompson Joi and Thompson Christine
Current Estimated Value
Purchase Details
Closed on
Jul 31, 1986
Sold by
Sagerman Gary D
Bought by
Keys Robert E
Purchase Details
Closed on
Oct 27, 1982
Sold by
Miceli Richard K
Bought by
Sagerman Gary D
Purchase Details
Closed on
Sep 9, 1981
Sold by
Gibson R M and E M
Bought by
Miceli Richard K
Purchase Details
Closed on
Jan 1, 1981
Bought by
Gibson R M and E M
Create a Home Valuation Report for This Property
The Home Valuation Report is an in-depth analysis detailing your home's value as well as a comparison with similar homes in the area
Home Values in the Area
Average Home Value in this Area
Purchase History
| Date | Buyer | Sale Price | Title Company |
|---|---|---|---|
| Garry A Thompson And Christine M Thompson Joi | -- | Bakerlaw Ltd | |
| Keys Robert E | $100,000 | -- | |
| Sagerman Gary D | $85,000 | -- | |
| Miceli Richard K | -- | -- | |
| Gibson R M | -- | -- |
Source: Public Records
Tax History Compared to Growth
Tax History
| Year | Tax Paid | Tax Assessment Tax Assessment Total Assessment is a certain percentage of the fair market value that is determined by local assessors to be the total taxable value of land and additions on the property. | Land | Improvement |
|---|---|---|---|---|
| 2024 | $6,520 | $100,415 | $28,455 | $71,960 |
| 2023 | $6,337 | $80,120 | $26,710 | $53,410 |
| 2022 | $6,288 | $80,120 | $26,710 | $53,410 |
| 2021 | $6,226 | $80,120 | $26,710 | $53,410 |
| 2020 | $6,146 | $70,280 | $23,420 | $46,870 |
| 2019 | $5,456 | $200,800 | $66,900 | $133,900 |
| 2018 | $5,444 | $70,280 | $23,420 | $46,870 |
| 2017 | $5,148 | $61,250 | $22,330 | $38,920 |
| 2016 | $5,123 | $61,250 | $22,330 | $38,920 |
| 2015 | $4,963 | $61,250 | $22,330 | $38,920 |
| 2014 | $4,963 | $57,790 | $21,070 | $36,720 |
Source: Public Records
Map
Nearby Homes
- 9190 Waterfall Dr
- 9180 Waterfall Dr
- 9430 Columbia Rd
- Caroline Plan at Falls Landing - Villas
- Wexford Plan at Falls Landing - Villas
- Rosecliff Plan at Falls Landing - Villas
- 24628 Sprague Rd
- 26179 Raintree Blvd Unit D8
- 26187 Raintree Blvd Unit C5
- 26183 Raintree Blvd Unit C-10
- Anderson Plan at Smokestack Trails
- Bramante Ranch Plan at Smokestack Trails
- Hudson Plan at Smokestack Trails
- Columbia Plan at Smokestack Trails
- Lehigh Plan at Smokestack Trails
- 9947 Magnolia Dr Unit 14
- 9855 Dupont Dr
- 26511 Locust Dr
- 26523 Sussex Dr
- 26508 Redwood Dr
- 9533 Charney Cir
- 25394 Tyndall Falls Dr
- 25398 Tyndall Falls Dr
- 9529 Charney Cir
- 9532 Charney Cir
- 9536 Charney Cir
- 9528 Charney Cir
- 25386 Tyndall Falls Dr
- 9540 Charney Cir
- 9544 Charney Cir
- 9548 Charney Cir
- 9525 Charney Cir
- 9524 Charney Cir
- 25382 Tyndall Falls Dr
- 9520 Charney Cir
- 25389 Tyndall Falls Dr
- 25418 Tyndall Falls Dr
- 25378 Tyndall Falls Dr
- 25397 Tyndall Falls Dr
- 25393 Tyndall Falls Dr