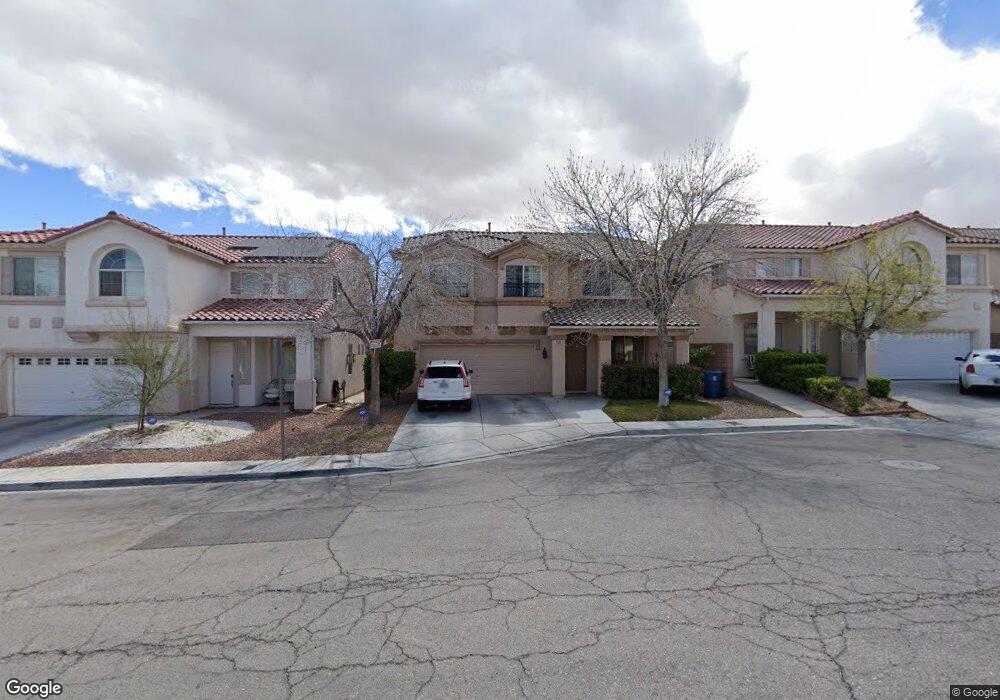
9539 Creedmoor Ct Las Vegas, NV 89148
Estimated Value: $521,000 - $577,000
3
Beds
3
Baths
2,556
Sq Ft
$214/Sq Ft
Est. Value
About This Home
This home is located at 9539 Creedmoor Ct, Las Vegas, NV 89148 and is currently estimated at $546,927, approximately $213 per square foot. 9539 Creedmoor Ct is a home located in Clark County with nearby schools including Kathy L. Batterman Elementary School, Victoria Fertitta Middle School, and Durango High School.
Ownership History
Date
Name
Owned For
Owner Type
Purchase Details
Closed on
Feb 20, 2004
Sold by
Martinez Arturo D and Martinez Arturo R
Bought by
Martinez Arturo R and Martinez Beatriz D
Current Estimated Value
Purchase Details
Closed on
Mar 28, 2002
Sold by
Martinez Beatriz D and Martinez Arturo D
Bought by
Martinez Arturo R and Martinez Beatriz D
Purchase Details
Closed on
Aug 27, 2001
Sold by
Martinez Arturo R
Bought by
Martinez Beatriz D
Home Financials for this Owner
Home Financials are based on the most recent Mortgage that was taken out on this home.
Original Mortgage
$161,350
Interest Rate
7.21%
Purchase Details
Closed on
Aug 23, 2001
Sold by
Kb Home Nevada Inc
Bought by
Martinez Arturo D and Martinez Beatris D
Home Financials for this Owner
Home Financials are based on the most recent Mortgage that was taken out on this home.
Original Mortgage
$161,350
Interest Rate
7.21%
Create a Home Valuation Report for This Property
The Home Valuation Report is an in-depth analysis detailing your home's value as well as a comparison with similar homes in the area
Home Values in the Area
Average Home Value in this Area
Purchase History
| Date | Buyer | Sale Price | Title Company |
|---|---|---|---|
| Martinez Arturo R | -- | Fidelity National Title | |
| Martinez Arturo R | -- | -- | |
| Martinez Beatriz D | -- | First American Title Co | |
| Martinez Arturo D | $201,740 | First American Title Co |
Source: Public Records
Mortgage History
| Date | Status | Borrower | Loan Amount |
|---|---|---|---|
| Previous Owner | Martinez Arturo D | $161,350 |
Source: Public Records
Tax History Compared to Growth
Tax History
| Year | Tax Paid | Tax Assessment Tax Assessment Total Assessment is a certain percentage of the fair market value that is determined by local assessors to be the total taxable value of land and additions on the property. | Land | Improvement |
|---|---|---|---|---|
| 2025 | $2,328 | $134,790 | $43,750 | $91,040 |
| 2024 | $2,261 | $134,790 | $43,750 | $91,040 |
| 2023 | $2,261 | $122,547 | $36,400 | $86,147 |
| 2022 | $2,407 | $105,267 | $26,600 | $78,667 |
| 2021 | $2,229 | $100,028 | $25,200 | $74,828 |
| 2020 | $2,066 | $102,046 | $28,000 | $74,046 |
| 2019 | $1,937 | $93,763 | $20,650 | $73,113 |
| 2018 | $1,848 | $87,378 | $17,500 | $69,878 |
| 2017 | $2,558 | $87,214 | $16,450 | $70,764 |
| 2016 | $1,703 | $84,075 | $14,350 | $69,725 |
| 2015 | $1,700 | $79,578 | $10,850 | $68,728 |
| 2014 | $1,650 | $54,581 | $7,350 | $47,231 |
Source: Public Records
Map
Nearby Homes
- 9472 W Diablo Dr
- 9631 Tuscola Ct
- 5554 Chicory Falls Ct
- 9687 Ridgebluff Ave
- 9522 Arrowhead Falls Ct
- 9750 Maple Sugar Leaf Place
- 5533 Sterling Valley Ct
- 9862 Shadow Grove Ave
- 9731 Cathedral Stairs Ct
- 5697 Tapestry Rose Ct
- 9693 Bighorn Island Ave
- 5548 Anshan St
- 9217 Valley Betica Ave
- 9205 Valley Betica Ave
- 5544 Jinsha River St
- 9580 W Reno Ave Unit 261
- 9580 W Reno Ave Unit 240
- 9580 W Reno Ave Unit 233
- 9580 W Reno Ave Unit 238
- 5048 Orchid Springs St
- 9533 Creedmoor Ct
- 9545 Creedmoor Ct
- 9540 Creswell Ct
- 9527 Creedmoor Ct
- 9553 Havelock Ct
- 9534 Creswell Ct
- 9546 Creswell Ct
- 9528 Creswell Ct
- 9554 Newton Grove Ct
- 9544 Creedmoor Ct
- 9561 Havelock Ct
- 9538 Creedmoor Ct
- 9538 Creedmoor Ct Unit 9999
- 9532 Creedmoor Ct
- 9552 Havelock Ct
- 9562 Newton Grove Ct
- 9526 Creedmoor Ct
- 9569 Havelock Ct
- 9560 Havelock Ct
- 5438 Avent Ferry St