Estimated Value: $598,000 - $628,000
Studio
4
Baths
2,972
Sq Ft
$207/Sq Ft
Est. Value
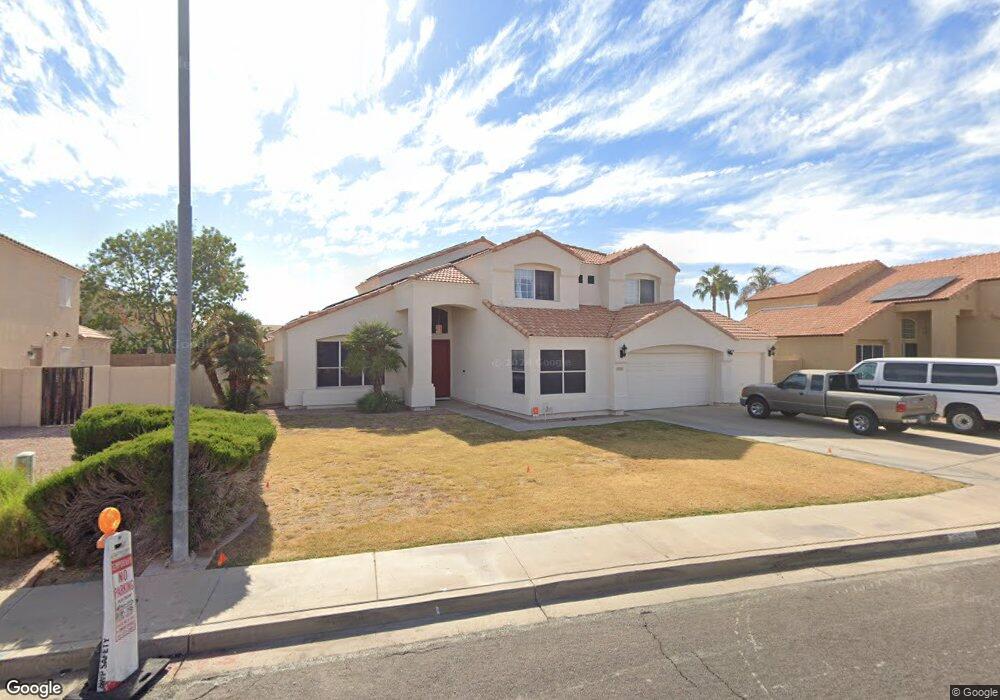
About This Home
This home is located at 9539 E Impala Ave, Mesa, AZ 85209 and is currently estimated at $615,422, approximately $207 per square foot. 9539 E Impala Ave is a home located in Maricopa County with nearby schools including Patterson Elementary School, Franklin at Brimhall Elementary School, and Franklin West Elementary School.
Ownership History
Date
Name
Owned For
Owner Type
Purchase Details
Closed on
Mar 25, 2022
Sold by
Sandles Joe N and Sandles Verlin B
Bought by
Joe N Sandles And Verlin B Sandles Living Tru
Current Estimated Value
Home Financials for this Owner
Home Financials are based on the most recent Mortgage that was taken out on this home.
Original Mortgage
$330,000
Outstanding Balance
$310,012
Interest Rate
4.42%
Mortgage Type
New Conventional
Estimated Equity
$305,410
Purchase Details
Closed on
Mar 21, 2022
Sold by
Sandles Joe N and Sandles Verlin B
Bought by
Joe N Sandles And Verlin B Sandles Living Tru
Home Financials for this Owner
Home Financials are based on the most recent Mortgage that was taken out on this home.
Original Mortgage
$330,000
Outstanding Balance
$310,012
Interest Rate
4.42%
Mortgage Type
New Conventional
Estimated Equity
$305,410
Purchase Details
Closed on
Jan 2, 2021
Sold by
Sandles Joe N and Sandles Verlin B
Bought by
Sandles Joe N and Sandles Verlin B
Home Financials for this Owner
Home Financials are based on the most recent Mortgage that was taken out on this home.
Original Mortgage
$265,800
Interest Rate
2.7%
Mortgage Type
New Conventional
Purchase Details
Closed on
Feb 3, 2020
Sold by
Sandles Joe N and Sandles Verlin B
Bought by
Sandles Joe N and Sandles Verlin B
Home Financials for this Owner
Home Financials are based on the most recent Mortgage that was taken out on this home.
Original Mortgage
$258,000
Interest Rate
3.72%
Mortgage Type
New Conventional
Purchase Details
Closed on
May 2, 2002
Sold by
Sandles Joe N and Sandles Verlin B
Bought by
Sandles Joe N and Sandles Verlin B
Home Financials for this Owner
Home Financials are based on the most recent Mortgage that was taken out on this home.
Original Mortgage
$266,333
Interest Rate
3.45%
Mortgage Type
VA
Purchase Details
Closed on
May 26, 1999
Sold by
Nyberg Mastrorilli Todd R
Bought by
Mastrorilli Amy R
Purchase Details
Closed on
Nov 21, 1997
Sold by
Sr Ii Llc
Bought by
Sandles Joe N and Sandles Verlin B
Home Financials for this Owner
Home Financials are based on the most recent Mortgage that was taken out on this home.
Original Mortgage
$178,347
Interest Rate
7.33%
Mortgage Type
VA
Create a Home Valuation Report for This Property
The Home Valuation Report is an in-depth analysis detailing your home's value as well as a comparison with similar homes in the area
Purchase History
| Date | Buyer | Sale Price | Title Company |
|---|---|---|---|
| Joe N Sandles And Verlin B Sandles Living Tru | -- | None Listed On Document | |
| Sandles Joe | -- | None Listed On Document | |
| Joe N Sandles And Verlin B Sandles Living Tru | -- | None Listed On Document | |
| Sandles Joe | -- | None Listed On Document | |
| Sandles Joe N | -- | None Available | |
| Sandles Joe N | -- | None Available | |
| Sandles Joe N | -- | Amrock | |
| Sandles Joe N | -- | Amrock | |
| Sandles Joe N | -- | None Available | |
| Sandles Joe N | -- | None Available | |
| Sandles Joe N | -- | -- | |
| Mastrorilli Amy R | -- | -- | |
| Beazer Homes Sales Arizona Inc | -- | First American Title | |
| Sandles Joe N | $174,856 | Chicago Title Insurance Co |
Source: Public Records
Mortgage History
| Date | Status | Borrower | Loan Amount |
|---|---|---|---|
| Open | Sandles Joe | $330,000 | |
| Closed | Sandles Joe | $330,000 | |
| Previous Owner | Sandles Joe N | $265,800 | |
| Previous Owner | Sandles Joe N | $258,000 | |
| Previous Owner | Sandles Joe N | $266,333 | |
| Previous Owner | Sandles Joe N | $178,347 |
Source: Public Records
Tax History
| Year | Tax Paid | Tax Assessment Tax Assessment Total Assessment is a certain percentage of the fair market value that is determined by local assessors to be the total taxable value of land and additions on the property. | Land | Improvement |
|---|---|---|---|---|
| 2025 | $2,445 | $29,406 | -- | -- |
| 2024 | $2,471 | $28,006 | -- | -- |
| 2023 | $2,471 | $43,800 | $8,760 | $35,040 |
| 2022 | $2,417 | $33,510 | $6,700 | $26,810 |
| 2021 | $2,483 | $31,750 | $6,350 | $25,400 |
| 2020 | $2,450 | $29,180 | $5,830 | $23,350 |
| 2019 | $2,270 | $27,130 | $5,420 | $21,710 |
| 2018 | $2,168 | $25,760 | $5,150 | $20,610 |
| 2017 | $2,100 | $24,720 | $4,940 | $19,780 |
| 2016 | $2,053 | $24,200 | $4,840 | $19,360 |
| 2015 | $1,947 | $24,160 | $4,830 | $19,330 |
Source: Public Records
Map
Nearby Homes
- 9558 E Jan Ave
- 1747 S 96th St
- 9639 E Impala Ave
- 9423 E Impala Ave
- 9563 E Javelina Ave
- 1737 S Talbot
- 1938 S Noble
- 1648 S Faith
- 9728 E Kiva Ave
- 9834 E Irwin Cir
- 1957 S Talbot Cir
- 9851 E Irwin Cir
- 2024 S Baldwin Unit 125
- 2024 S Baldwin Unit 54
- 2024 S Baldwin Unit 64
- 2024 S Baldwin Unit 15
- 9628 E Lindner Ave
- 9534 E Keats Ave
- 1650 S Crismon Rd Unit 86
- 10202 E Juanita Ave
- 9547 E Impala Ave
- 9531 E Impala Ave
- 9540 E Jan Ave
- 9532 E Jan Ave
- 9548 E Jan Ave
- 9523 E Impala Ave
- 9557 E Impala Ave
- 9540 E Impala Ave
- 9524 E Jan Ave
- 9548 E Impala Ave
- 9532 E Impala Ave
- 9558 E Impala Ave
- 9524 E Impala Ave
- 9515 E Impala Ave
- 9515 E Impala Ave
- 9516 E Jan Ave
- 9533 E Jan Ave
- 9541 E Jan Ave
- 9525 E Jan Ave
- 9549 E Jan Ave
Your Personal Tour Guide
Ask me questions while you tour the home.