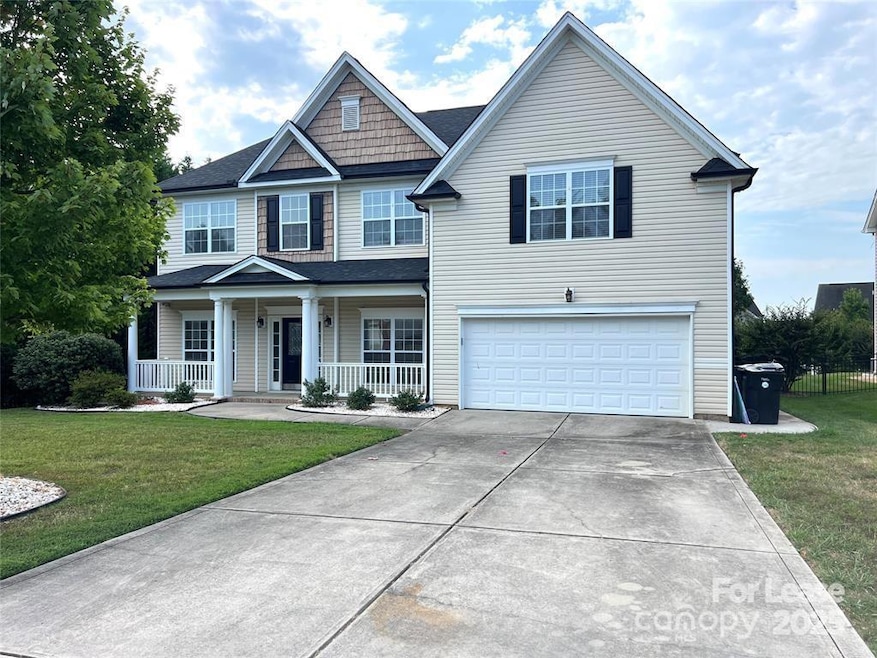
9539 Indian Beech Ave NW Concord, NC 28027
Highlights
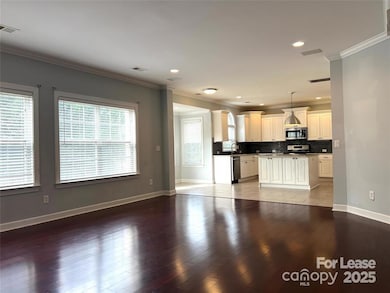
- Open Floorplan
- Colonial Architecture
- Walk-In Pantry
- W.R. Odell Elementary School Rated A-
- Covered Patio or Porch
- 2 Car Attached Garage
About This Home
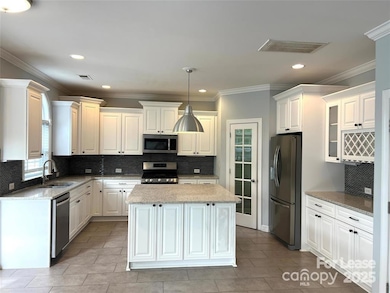
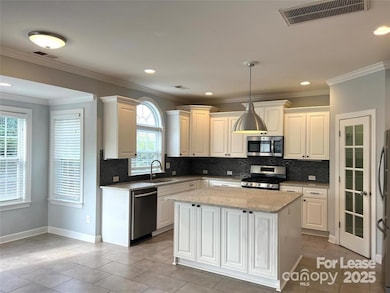
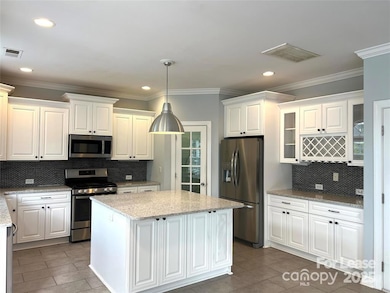
Welcome to your dream home in Concord’s prestigious Moss Creek community! This spacious, beautifully maintained residence offers an inviting open floor plan on the main level, featuring a formal dining room, guest bedroom, cozy living room, and a chef’s kitchen perfect for entertaining or family meals. Living in Moss Creek means enjoying resort-style amenities, including a large pool with a water slide, a lap pool, two kiddie pools with a play area, a playground, and courts for tennis, pickleball, and basketball. This home is a rare find in a vibrant and highly sought-after community, so don’t wait—schedule your private tour today and make this dream home yours!
Listing Agent
K.M.D. Realty Inc. Brokerage Email: re@kmdrealty.com License #222585 Listed on: 09/12/2025
Home Details
Home Type
- Single Family
Est. Annual Taxes
- $5,128
Year Built
- Built in 2007
Parking
- 2 Car Attached Garage
Home Design
- Colonial Architecture
- Entry on the 1st floor
Interior Spaces
- 2-Story Property
- Open Floorplan
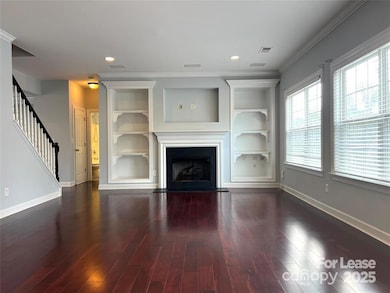
- Built-In Features
- Family Room with Fireplace
- Laundry on upper level
Kitchen
- Breakfast Bar
- Walk-In Pantry
- Electric Oven
- Electric Range
- Dishwasher
- Kitchen Island
- Disposal
Flooring
- Laminate
- Tile
Bedrooms and Bathrooms
- Split Bedroom Floorplan
- Walk-In Closet
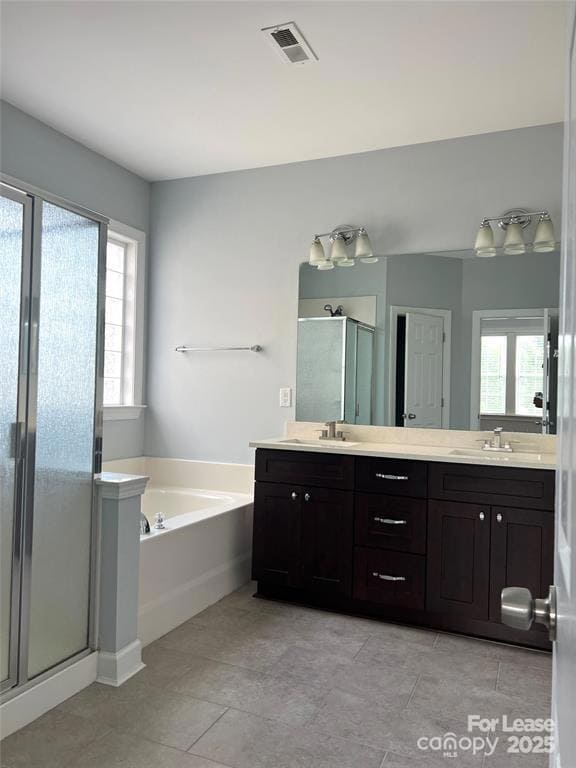
- 3 Full Bathrooms
- Garden Bath
Schools
- W.R. Odell Elementary School
- Harris Middle School
- Cox Mill High School
Utilities
- Forced Air Heating and Cooling System
- Heating System Uses Natural Gas
- Gas Water Heater
Additional Features
- Covered Patio or Porch
- Property is zoned CURM-2
Community Details
- Property has a Home Owners Association
- Moss Creek Village Subdivision
Listing and Financial Details
- Security Deposit $2,999
- Property Available on 9/12/25
- Tenant pays for all utilities
- 12-Month Minimum Lease Term
- Assessor Parcel Number 4681-28-0676-0000
Map
Source: Canopy MLS (Canopy Realtor® Association)
MLS Number: 4296595
APN: 4681-28-0676-0000
Disclaimer: Certain information contained herein is derived from information provided by parties other than Homes.com. All information provided is deemed reliable, but is not guaranteed to be accurate and should be independently verified.
![]() Based on information submitted to the MLS GRID. All data is obtained from various sources and may not have been verified by broker or MLS GRID. Supplied Open House Information is subject to change without notice. All information should be independently reviewed and verified for accuracy. Properties may or may not be listed by the office/agent presenting the information. Some IDX listings have been excluded from this website.
Based on information submitted to the MLS GRID. All data is obtained from various sources and may not have been verified by broker or MLS GRID. Supplied Open House Information is subject to change without notice. All information should be independently reviewed and verified for accuracy. Properties may or may not be listed by the office/agent presenting the information. Some IDX listings have been excluded from this website.
The Digital Millennium Copyright Act of 1998, 17 U.S.C. § 512 (the “DMCA”) provides recourse for copyright owners who believe that material appearing on the Internet infringes their rights under U.S. copyright law. If you believe in good faith that any content or material made available in connection with our website or services infringes your copyright, you (or your agent) may send us a notice requesting that the content or material be removed, or access to it blocked.
Notices must be sent in writing by email to DMCAnotice@MLSGrid.com.
The DMCA requires that your notice of alleged copyright infringement include the following information:
(1) description of the copyrighted work that is the subject of claimed infringement;
(2) description of the alleged infringing content and information sufficient to permit us to locate the content;
(3) contact information for you, including your address, telephone number and email address;
(4) a statement by you that you have a good faith belief that the content in the manner complained of is not authorized by the copyright owner, or its agent, or by the operation of any law;
(5) a statement by you, signed under penalty of perjury, that the information in the notification is accurate and that you have the authority to enforce the copyrights that are claimed to be infringed; and
(6) a physical or electronic signature of the copyright owner or a person authorized to act on the copyright owner’s behalf. Failure to include all of the above information may result in the delay of the processing of your complaint.
- 9562 Indian Beech Ave NW Unit 291
- 1559 Broderick St NW
- 1576 Abercorn St NW
- 9608 Indian Beech Ave NW
- 9607 Indian Beech Ave NW
- 1576 Bay Meadows Ave NW
- 1595 Bay Meadows Ave NW
- 1656 Respect St NW
- 1648 Respect St NW
- 1418 Skidaway St NW Unit 427
- 1598 Respect St NW
- 1498 Burrell Ave NW
- 9768 Walkers Glen Dr NW
- 9532 Teamwork St NW
- 1457 Prestbury Rd NW
- 9528 Teamwork St NW
- 9526 Teamwork St NW
- 1484 Haverford Rd NW
- 9524 Teamwork St NW
- 9393 Moss Plantation Ave NW
- 2054 Cypress Village Dr NW
- 2059 Cypress Village Dr NW
- 9412 Coddle Ct NW
- 2027 Cypress Village Dr NW
- 9421 Coddle Ct NW
- 1595 Tranquility Ave NW
- 9659 Widespread Ave NW
- 9626 Walkers Glen Dr NW
- 1848 Teachers House Rd NW
- 2299 Isaac St
- 2202 Laurens Dr
- 2605 Mill Wright Rd
- 1571 Cold Creek Place
- 1611 Rustic Arch Way
- 1717 Cabarrus Crossing Dr
- 10921 Dry Stone Dr
- 2002 Limestone Ct
- 1836 Meadow Crossing Dr
- 6112 Willow Pin Ln
- 10745 Sapphire Trail
