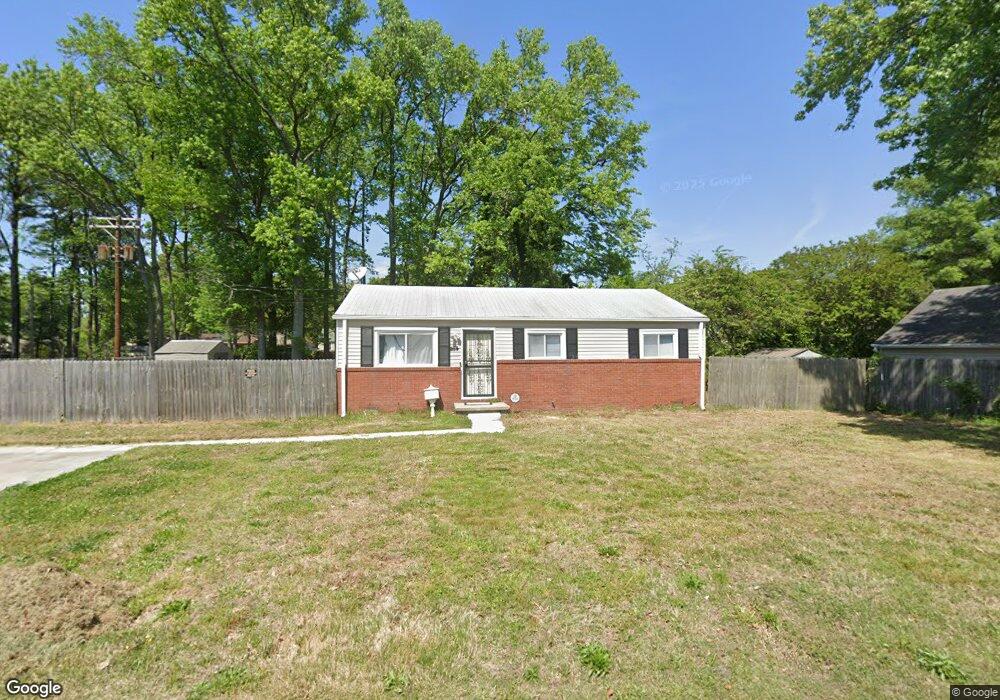
954 Dovercourt Rd Norfolk, VA 23518
Colonial Heights NeighborhoodEstimated Value: $252,000 - $275,000
3
Beds
1
Bath
1,001
Sq Ft
$258/Sq Ft
Est. Value
About This Home
This home is located at 954 Dovercourt Rd, Norfolk, VA 23518 and is currently estimated at $258,693, approximately $258 per square foot. 954 Dovercourt Rd is a home located in Norfolk City with nearby schools including Crossroads School, Norview Middle School, and Norview High School.
Ownership History
Date
Name
Owned For
Owner Type
Purchase Details
Closed on
Mar 28, 2022
Sold by
Burris Cynthia H
Bought by
Mccort Quinton and Mccort Angela Mae
Current Estimated Value
Home Financials for this Owner
Home Financials are based on the most recent Mortgage that was taken out on this home.
Original Mortgage
$212,784
Outstanding Balance
$199,896
Interest Rate
4.42%
Mortgage Type
VA
Estimated Equity
$58,797
Purchase Details
Closed on
Sep 9, 2019
Sold by
Cynthia Burris
Bought by
Burris Cynthia and Burris Kenneth M
Purchase Details
Closed on
Jul 20, 2006
Sold by
Neff Henderson Laura L
Bought by
Hernandez Cynthia
Home Financials for this Owner
Home Financials are based on the most recent Mortgage that was taken out on this home.
Original Mortgage
$158,332
Interest Rate
6.27%
Mortgage Type
VA
Purchase Details
Closed on
Jan 25, 2005
Sold by
Neff Gary Lee and Neff Sonyia L
Bought by
Neff Gary Lee and Neff Sonyia L
Create a Home Valuation Report for This Property
The Home Valuation Report is an in-depth analysis detailing your home's value as well as a comparison with similar homes in the area
Home Values in the Area
Average Home Value in this Area
Purchase History
| Date | Buyer | Sale Price | Title Company |
|---|---|---|---|
| Mccort Quinton | $208,000 | Fidelity National Title | |
| Burris Cynthia | -- | First American Title | |
| Hernandez Cynthia | $155,000 | -- | |
| Neff Gary Lee | -- | -- |
Source: Public Records
Mortgage History
| Date | Status | Borrower | Loan Amount |
|---|---|---|---|
| Open | Mccort Quinton | $212,784 | |
| Previous Owner | Hernandez Cynthia | $158,332 |
Source: Public Records
Tax History Compared to Growth
Tax History
| Year | Tax Paid | Tax Assessment Tax Assessment Total Assessment is a certain percentage of the fair market value that is determined by local assessors to be the total taxable value of land and additions on the property. | Land | Improvement |
|---|---|---|---|---|
| 2025 | $3,035 | $242,800 | $116,500 | $126,300 |
| 2024 | $2,876 | $233,800 | $116,500 | $117,300 |
| 2023 | $2,778 | $222,200 | $106,000 | $116,200 |
| 2022 | $2,751 | $220,100 | $106,000 | $114,100 |
| 2021 | $2,200 | $176,000 | $95,500 | $80,500 |
| 2020 | $2,050 | $164,000 | $83,500 | $80,500 |
| 2019 | $2,003 | $160,200 | $79,700 | $80,500 |
| 2018 | $1,946 | $155,700 | $79,700 | $76,000 |
| 2017 | $1,756 | $152,700 | $79,700 | $73,000 |
| 2016 | $1,756 | $152,900 | $79,700 | $73,200 |
| 2015 | $1,748 | $152,900 | $79,700 | $73,200 |
| 2014 | $1,748 | $152,900 | $79,700 | $73,200 |
Source: Public Records
Map
Nearby Homes
- 8016 Chesapeake Blvd
- 7945 Merritt St
- 7929 Pythian Ave
- 8045 Westcliff Dr
- 935 Avenue I
- 1112 Newell Ave
- 7923 Moose Ave
- 8205 Carlton St
- 8238 Chesapeake Blvd
- 1119 Winston St
- 963 Lena St
- 7446 Davidson St
- 8034 Old Ocean View Rd
- 8068 Moose Ave
- 8211 Carrene Dr
- 741 Bancker Rd
- 7801 Caribou Ave
- 977 Avenue G
- 8224 Tabor Ct
- 8123 Kenwood Dr
- 948 Dovercourt Rd
- 8009 Chesapeake Blvd
- 8017 Chesapeake Blvd
- 8003 Chesapeake Blvd
- 8021 Chesapeake Blvd
- 963 Brentwood Dr
- 8008 Ardmore Rd
- 8000 Ardmore Rd
- 8014 Ardmore Rd
- 8027 Chesapeake Blvd
- 8016 Ardmore Rd
- 7948 Ardmore Rd
- 7942 Ardmore Rd
- 8028 Ardmore Rd
- 8035 Chesapeake Blvd
- 7940 Ardmore Rd
- 7940 Ardmore Rd Unit A
- 7940 Ardmore Rd Unit B
- 7938 Ardmore Rd
- 8010 Chesapeake Blvd