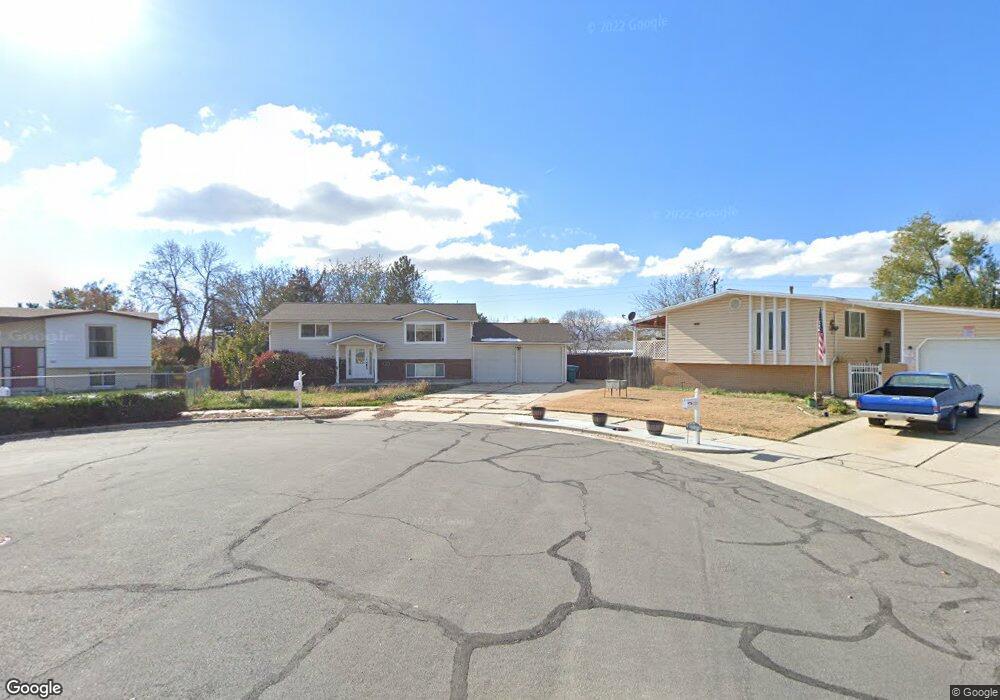
954 E 100 S Layton, UT 84041
Estimated Value: $444,000 - $570,000
4
Beds
2
Baths
2,008
Sq Ft
$243/Sq Ft
Est. Value
About This Home
This home is located at 954 E 100 S, Layton, UT 84041 and is currently estimated at $487,155, approximately $242 per square foot. 954 E 100 S is a home located in Davis County with nearby schools including Whitesides Elementary School, Fairfield Junior High School, and Layton High School.
Ownership History
Date
Name
Owned For
Owner Type
Purchase Details
Closed on
Jul 15, 2020
Sold by
Escobar David F
Bought by
Gerard Amanda French
Current Estimated Value
Purchase Details
Closed on
Mar 26, 2019
Sold by
Robins Jay W and Robins Kacie B
Bought by
Escobar David F
Home Financials for this Owner
Home Financials are based on the most recent Mortgage that was taken out on this home.
Original Mortgage
$279,037
Interest Rate
4.3%
Mortgage Type
FHA
Purchase Details
Closed on
Sep 12, 2013
Sold by
Robins Jay W
Bought by
Robins Jay W and Robins Kacie B
Purchase Details
Closed on
Sep 21, 2009
Sold by
Jones Tracy G and Jones Paula J
Bought by
Robins Jay W
Home Financials for this Owner
Home Financials are based on the most recent Mortgage that was taken out on this home.
Original Mortgage
$161,500
Interest Rate
5.25%
Mortgage Type
New Conventional
Purchase Details
Closed on
Nov 21, 2001
Sold by
Jones Tracy G
Bought by
Jones Tracy G and Jones Paula J
Create a Home Valuation Report for This Property
The Home Valuation Report is an in-depth analysis detailing your home's value as well as a comparison with similar homes in the area
Home Values in the Area
Average Home Value in this Area
Purchase History
| Date | Buyer | Sale Price | Title Company |
|---|---|---|---|
| Gerard Amanda French | -- | Advanced Title Ins | |
| Escobar David F | -- | Metro National Title | |
| Robins Jay W | -- | None Available | |
| Robins Jay W | -- | Inwest Title Services Inc | |
| Jones Tracy G | -- | First American Title Ins Co |
Source: Public Records
Mortgage History
| Date | Status | Borrower | Loan Amount |
|---|---|---|---|
| Previous Owner | Escobar David F | $279,037 | |
| Previous Owner | Robins Jay W | $161,500 |
Source: Public Records
Tax History
| Year | Tax Paid | Tax Assessment Tax Assessment Total Assessment is a certain percentage of the fair market value that is determined by local assessors to be the total taxable value of land and additions on the property. | Land | Improvement |
|---|---|---|---|---|
| 2025 | $2,237 | $234,850 | $120,035 | $114,815 |
| 2024 | $2,247 | $237,600 | $139,046 | $98,554 |
| 2023 | $2,216 | $413,000 | $157,907 | $255,093 |
| 2022 | $2,309 | $233,750 | $85,673 | $148,077 |
| 2021 | $2,153 | $325,000 | $126,176 | $198,824 |
| 2020 | $1,906 | $276,000 | $103,613 | $172,387 |
| 2019 | $1,692 | $240,000 | $96,136 | $143,864 |
| 2018 | $1,545 | $220,000 | $96,136 | $123,864 |
| 2016 | $1,319 | $96,910 | $32,353 | $64,557 |
| 2015 | $1,263 | $88,055 | $32,353 | $55,702 |
| 2014 | $1,189 | $84,750 | $32,353 | $52,397 |
| 2013 | -- | $90,159 | $20,856 | $69,303 |
Source: Public Records
Map
Nearby Homes
- 187 N Talbot Dr
- 9 Colonial Ave
- 1137 Holmes Creek Ln
- 86 Mill Rd
- 1368 E 275 S
- 508 N Adamswood Rd
- 149 N Fort Ln Unit 1D
- 617 E 405 S
- 556 N Fairfield Rd Unit A2
- 556 N Fairfield Rd Unit D1
- 556 N Fairfield Rd Unit D2
- 556 N Fairfield Rd Unit A3
- 556 N Fairfield Rd Unit D3
- 556 N Fairfield Rd Unit D4
- 556 N Fairfield Rd Unit A1
- 556 N Fairfield Rd Unit A4
- 479 N 1375 E
- 861 E 575 N
- 1515 E Gentile St
- 389 Morgan St
Your Personal Tour Guide
Ask me questions while you tour the home.