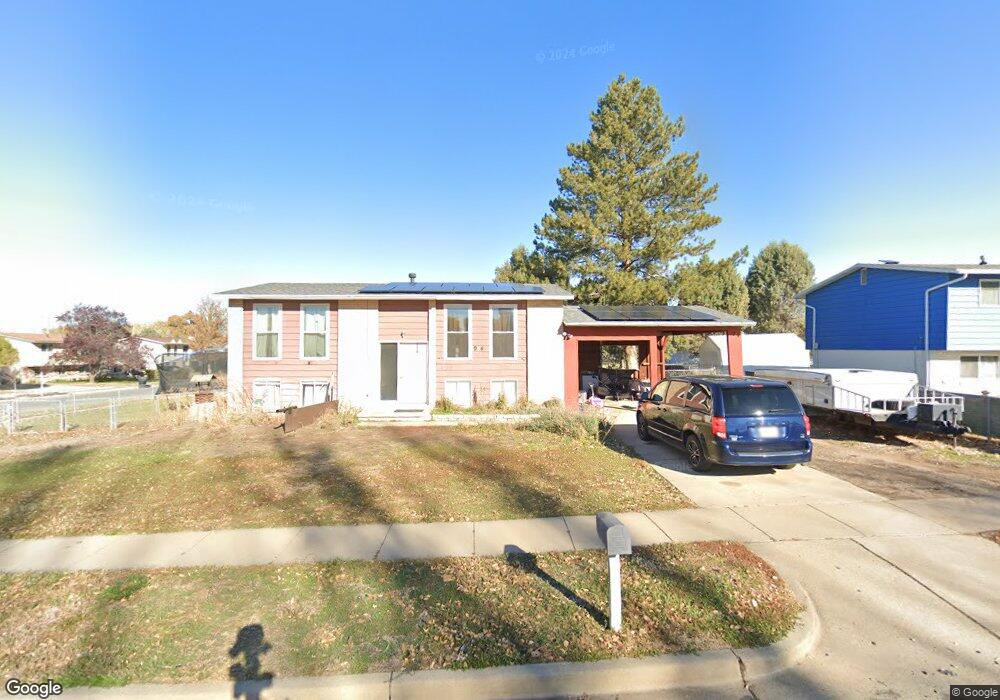
954 W 2400 N Clearfield, UT 84015
Estimated Value: $376,000 - $399,543
4
Beds
2
Baths
1,728
Sq Ft
$224/Sq Ft
Est. Value
About This Home
This home is located at 954 W 2400 N, Clearfield, UT 84015 and is currently estimated at $386,386, approximately $223 per square foot. 954 W 2400 N is a home located in Davis County with nearby schools including Fremont School, Sunset Junior High School, and Northridge High School.
Ownership History
Date
Name
Owned For
Owner Type
Purchase Details
Closed on
Jul 18, 2023
Sold by
Lujan Casey
Bought by
Dee Tyler W
Current Estimated Value
Home Financials for this Owner
Home Financials are based on the most recent Mortgage that was taken out on this home.
Original Mortgage
$345,624
Outstanding Balance
$337,225
Interest Rate
6.69%
Mortgage Type
FHA
Estimated Equity
$49,161
Purchase Details
Closed on
Jul 10, 2018
Sold by
Morales Ruben and Morales Debbie J
Bought by
Lujan Casey
Home Financials for this Owner
Home Financials are based on the most recent Mortgage that was taken out on this home.
Original Mortgage
$218,960
Interest Rate
4.75%
Mortgage Type
FHA
Purchase Details
Closed on
Jun 26, 1997
Sold by
Folk Laurie J
Bought by
Morales Ruben and Morales Debbie J
Home Financials for this Owner
Home Financials are based on the most recent Mortgage that was taken out on this home.
Original Mortgage
$93,763
Interest Rate
7.91%
Mortgage Type
FHA
Create a Home Valuation Report for This Property
The Home Valuation Report is an in-depth analysis detailing your home's value as well as a comparison with similar homes in the area
Home Values in the Area
Average Home Value in this Area
Purchase History
| Date | Buyer | Sale Price | Title Company |
|---|---|---|---|
| Dee Tyler W | -- | Prospect Title Insurance | |
| Lujan Casey | -- | Metro National Title | |
| Morales Ruben | -- | Bonneville Title Company Inc |
Source: Public Records
Mortgage History
| Date | Status | Borrower | Loan Amount |
|---|---|---|---|
| Open | Dee Tyler W | $345,624 | |
| Previous Owner | Lujan Casey | $218,960 | |
| Previous Owner | Morales Ruben | $93,763 |
Source: Public Records
Tax History Compared to Growth
Tax History
| Year | Tax Paid | Tax Assessment Tax Assessment Total Assessment is a certain percentage of the fair market value that is determined by local assessors to be the total taxable value of land and additions on the property. | Land | Improvement |
|---|---|---|---|---|
| 2025 | $2,002 | $192,500 | $85,161 | $107,339 |
| 2024 | $1,957 | $189,200 | $93,680 | $95,520 |
| 2023 | $1,789 | $320,000 | $106,462 | $213,538 |
| 2022 | $1,990 | $196,900 | $65,273 | $131,627 |
| 2021 | $1,826 | $268,000 | $81,460 | $186,540 |
| 2020 | $1,577 | $229,000 | $69,082 | $159,918 |
| 2019 | $1,529 | $217,000 | $80,979 | $136,021 |
| 2018 | $1,270 | $177,000 | $68,431 | $108,569 |
| 2016 | $1,088 | $78,320 | $26,619 | $51,701 |
| 2015 | $1,055 | $72,215 | $26,619 | $45,596 |
| 2014 | $994 | $69,136 | $26,619 | $42,517 |
| 2013 | -- | $72,136 | $25,230 | $46,906 |
Source: Public Records
Map
Nearby Homes