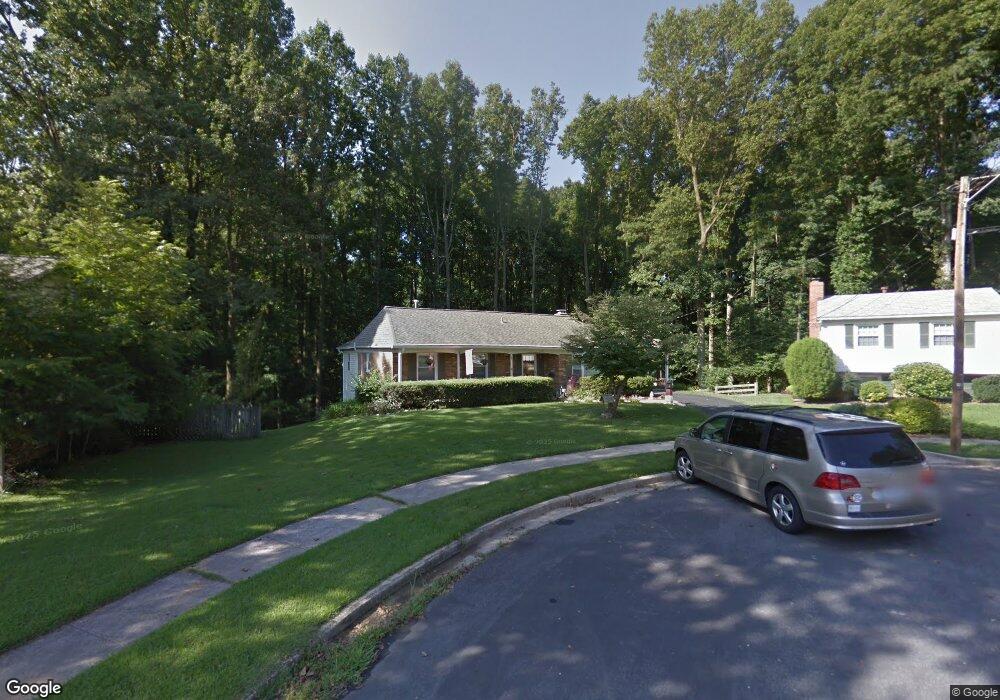
9541 Barkwood Ct Fairfax, VA 22032
Estimated Value: $751,000 - $854,000
4
Beds
3
Baths
2,800
Sq Ft
$293/Sq Ft
Est. Value
About This Home
This home is located at 9541 Barkwood Ct, Fairfax, VA 22032 and is currently estimated at $820,227, approximately $292 per square foot. 9541 Barkwood Ct is a home located in Fairfax County with nearby schools including Olde Creek Elementary School, Frost Middle School, and W. T. Woodson High School.
Ownership History
Date
Name
Owned For
Owner Type
Purchase Details
Closed on
Oct 22, 2002
Sold by
Britton Daniel G
Bought by
Dinicola Justin F
Current Estimated Value
Home Financials for this Owner
Home Financials are based on the most recent Mortgage that was taken out on this home.
Original Mortgage
$268,000
Outstanding Balance
$112,685
Interest Rate
6.2%
Estimated Equity
$707,542
Purchase Details
Closed on
Jan 29, 1999
Sold by
Mason Patrick T
Bought by
Britton Daniel G
Home Financials for this Owner
Home Financials are based on the most recent Mortgage that was taken out on this home.
Original Mortgage
$175,950
Interest Rate
6.67%
Purchase Details
Closed on
Nov 3, 1997
Sold by
Ferguson William W and Ferguson Susan H
Bought by
Mason Patrick T and Mason Sandra S
Home Financials for this Owner
Home Financials are based on the most recent Mortgage that was taken out on this home.
Original Mortgage
$157,600
Interest Rate
7.31%
Mortgage Type
New Conventional
Create a Home Valuation Report for This Property
The Home Valuation Report is an in-depth analysis detailing your home's value as well as a comparison with similar homes in the area
Home Values in the Area
Average Home Value in this Area
Purchase History
| Date | Buyer | Sale Price | Title Company |
|---|---|---|---|
| Dinicola Justin F | $335,000 | -- | |
| Britton Daniel G | $207,000 | -- | |
| Mason Patrick T | $197,000 | -- |
Source: Public Records
Mortgage History
| Date | Status | Borrower | Loan Amount |
|---|---|---|---|
| Open | Dinicola Justin F | $268,000 | |
| Previous Owner | Britton Daniel G | $175,950 | |
| Previous Owner | Mason Patrick T | $157,600 |
Source: Public Records
Tax History Compared to Growth
Tax History
| Year | Tax Paid | Tax Assessment Tax Assessment Total Assessment is a certain percentage of the fair market value that is determined by local assessors to be the total taxable value of land and additions on the property. | Land | Improvement |
|---|---|---|---|---|
| 2025 | $8,254 | $783,600 | $331,000 | $452,600 |
| 2024 | $8,254 | $712,450 | $301,000 | $411,450 |
| 2023 | $7,792 | $690,470 | $291,000 | $399,470 |
| 2022 | $7,222 | $631,610 | $271,000 | $360,610 |
| 2021 | $6,956 | $592,740 | $246,000 | $346,740 |
| 2020 | $6,510 | $550,060 | $226,000 | $324,060 |
| 2019 | $6,257 | $528,710 | $211,000 | $317,710 |
| 2018 | $5,906 | $513,580 | $211,000 | $302,580 |
| 2017 | $5,963 | $513,580 | $211,000 | $302,580 |
| 2016 | $5,815 | $501,940 | $211,000 | $290,940 |
| 2015 | $5,464 | $489,580 | $205,000 | $284,580 |
| 2014 | $5,105 | $458,500 | $195,000 | $263,500 |
Source: Public Records
Map
Nearby Homes
- 4222 Braeburn Dr
- 4301 Braeburn Dr
- 9308 Ashmeade Dr
- 4906 Mcfarland Dr
- 4869 Nash Dr
- 4314 Selkirk Dr
- 10021 Glenmere Rd
- 10134 Red Spruce Rd
- 9900 Barbara Ann Ln
- 3975 Lyndhurst Dr Unit 103
- 9017 Ellenwood Ln
- 9117 Hunting Pines Place
- 5037 Head Ct
- 9207 Hunting Pines Place
- 4903 King David Blvd
- 4211 Orchard Dr
- 3680 Persimmon Cir
- 3704 Persimmon Cir
- 3874 Lyndhurst Dr Unit 103
- 3814 Persimmon Cir
- 9539 Barkwood Ct
- 9543 Barkwood Ct
- 9537 Barkwood Ct
- 9544 Barkwood Ct
- 9542 Barkwood Ct
- 9540 Barkwood Ct
- 9535 Barkwood Ct
- 9534 Barkwood Ct
- 4306 Branchview Way
- 9533 Barkwood Ct
- 4304 Branchview Way
- 4307 Branchview Way
- 9532 Barkwood Ct
- 9531 Barkwood Ct
- 9530 Barkwood Ct
- 9532 Old Creek Dr
- 4305 Branchview Way
- 9534 Old Creek Dr
- 9536 Old Creek Dr
- 4308 Hollowview Ct