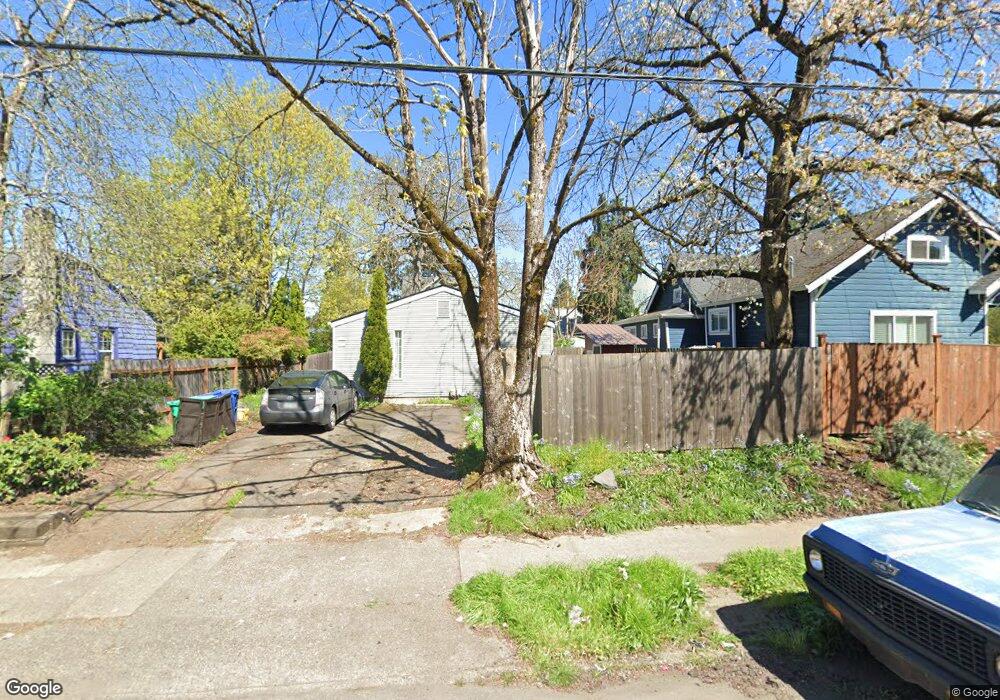
9543 N Lombard St Unit 9545 Portland, OR 97203
Saint Johns NeighborhoodEstimated Value: $408,000 - $539,000
4
Beds
2
Baths
1,560
Sq Ft
$304/Sq Ft
Est. Value
About This Home
This home is located at 9543 N Lombard St Unit 9545, Portland, OR 97203 and is currently estimated at $473,863, approximately $303 per square foot. 9543 N Lombard St Unit 9545 is a home located in Multnomah County with nearby schools including Sitton Elementary School, George Middle School, and Roosevelt High School.
Ownership History
Date
Name
Owned For
Owner Type
Purchase Details
Closed on
Nov 20, 2012
Sold by
Wiens Paul Scott
Bought by
Dodd Matthew M and Morgan Catherine L
Current Estimated Value
Home Financials for this Owner
Home Financials are based on the most recent Mortgage that was taken out on this home.
Original Mortgage
$165,000
Outstanding Balance
$113,802
Interest Rate
3.35%
Mortgage Type
New Conventional
Estimated Equity
$360,061
Purchase Details
Closed on
Feb 25, 2005
Sold by
Hendricks James R
Bought by
Wiens Paul Scott and Wiens Joy E
Home Financials for this Owner
Home Financials are based on the most recent Mortgage that was taken out on this home.
Original Mortgage
$127,450
Interest Rate
5.73%
Mortgage Type
Purchase Money Mortgage
Purchase Details
Closed on
Jul 9, 2003
Sold by
Nelson Kristine E
Bought by
Nelson Kristine E and Kristine E Nelson Trust
Create a Home Valuation Report for This Property
The Home Valuation Report is an in-depth analysis detailing your home's value as well as a comparison with similar homes in the area
Home Values in the Area
Average Home Value in this Area
Purchase History
| Date | Buyer | Sale Price | Title Company |
|---|---|---|---|
| Dodd Matthew M | $220,000 | Lawyers Title | |
| Wiens Paul Scott | $169,950 | Ticor Title Insurance Compan | |
| Nelson Kristine E | -- | -- |
Source: Public Records
Mortgage History
| Date | Status | Borrower | Loan Amount |
|---|---|---|---|
| Open | Dodd Matthew M | $165,000 | |
| Previous Owner | Wiens Paul Scott | $127,450 | |
| Closed | Wiens Paul Scott | $25,450 |
Source: Public Records
Tax History Compared to Growth
Tax History
| Year | Tax Paid | Tax Assessment Tax Assessment Total Assessment is a certain percentage of the fair market value that is determined by local assessors to be the total taxable value of land and additions on the property. | Land | Improvement |
|---|---|---|---|---|
| 2024 | $4,221 | $157,780 | -- | -- |
| 2023 | $4,059 | $153,190 | $0 | $0 |
| 2022 | $3,971 | $148,730 | $0 | $0 |
| 2021 | $3,904 | $144,400 | $0 | $0 |
| 2020 | $3,582 | $140,200 | $0 | $0 |
| 2019 | $3,450 | $136,120 | $0 | $0 |
| 2018 | $3,349 | $132,160 | $0 | $0 |
| 2017 | $3,210 | $128,320 | $0 | $0 |
| 2016 | $2,938 | $124,590 | $0 | $0 |
| 2015 | $2,861 | $120,970 | $0 | $0 |
| 2014 | $2,817 | $117,450 | $0 | $0 |
Source: Public Records
Map
Nearby Homes
- 9334 N Lombard St
- 9709 N Jersey St
- 9306 N Ivanhoe St
- 9712 N Ivanhoe St
- 9131 N Lombard St
- 7428 N Saint Louis Ave
- 9116 N Syracuse St
- 7467 N New York Ave Unit 5
- 7206 N Saint Louis Ave
- 7471 N New York Ave Unit 3
- 9116 N Willamette Blvd
- 9702 N Edison St
- 7302 N New York Ave Unit 6
- 9953 N Central St
- 9212 N Saint Louis Ave
- 9342 N Saint Johns Ave
- 9927 N Decatur St
- 9414 N Bristol Ave
- 9416 N Bristol Ave
- 9420 N Bristol Ave
- 9545 N Lombard St
- 9533 N Lombard St
- 9555 N Lombard St
- 9529 N Lombard St Unit 26
- 9529 N Lombard St
- 9525 N Lombard St
- 9544 N Kellogg St
- 9567 N Lombard St
- 9534 N Kellogg St
- 9554 N Kellogg St
- 9524 N Kellogg St
- 9564 N Kellogg St
- 9515 N Lombard St
- 9579 N Lombard St Unit 9581
- 9550 N Lombard St Unit 9554
- 9514 N Kellogg St
- 9560 N Lombard St
- 9501 N Lombard St Unit 1
- 9501 N Lombard St
- 9585 N Lombard St