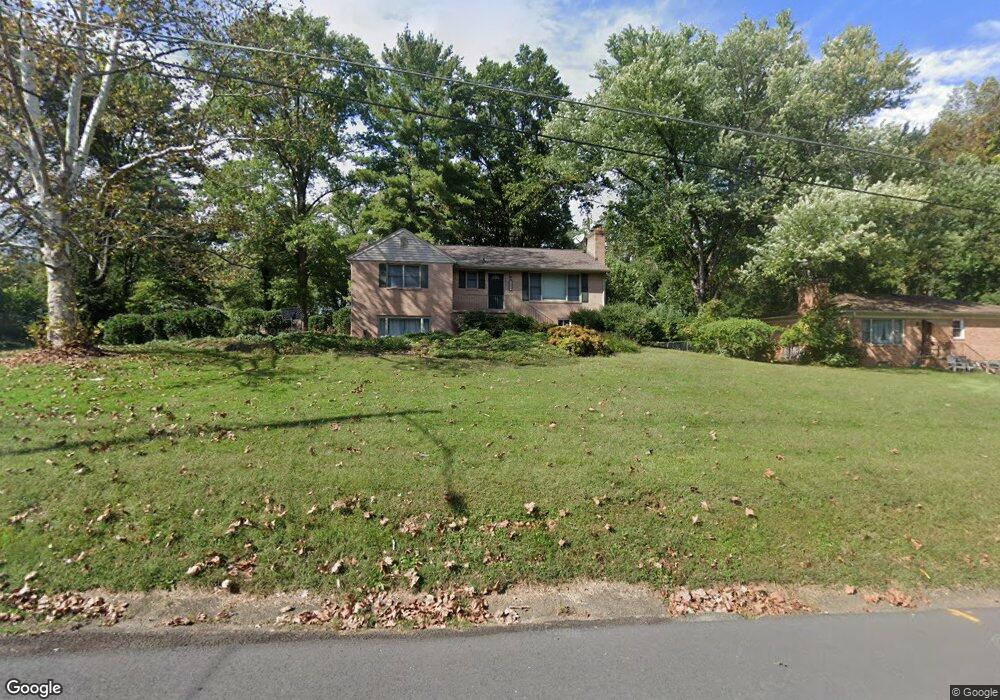
9544 Bel Glade St Fairfax, VA 22031
Estimated Value: $791,000 - $882,000
3
Beds
3
Baths
1,384
Sq Ft
$608/Sq Ft
Est. Value
About This Home
This home is located at 9544 Bel Glade St, Fairfax, VA 22031 and is currently estimated at $841,266, approximately $607 per square foot. 9544 Bel Glade St is a home located in Fairfax County with nearby schools including Mosby Woods Elementary School, Thoreau Middle School, and Appletree School.
Ownership History
Date
Name
Owned For
Owner Type
Purchase Details
Closed on
Feb 21, 2020
Sold by
Kline Lisa R and Kline Lucas J
Bought by
Kline Lisa R
Current Estimated Value
Home Financials for this Owner
Home Financials are based on the most recent Mortgage that was taken out on this home.
Original Mortgage
$510,400
Outstanding Balance
$451,923
Interest Rate
3.6%
Mortgage Type
New Conventional
Estimated Equity
$389,343
Purchase Details
Closed on
Sep 23, 2010
Sold by
Chamberlin William P and Jackson Nancy
Bought by
Kline Lisa R
Home Financials for this Owner
Home Financials are based on the most recent Mortgage that was taken out on this home.
Original Mortgage
$498,000
Interest Rate
4.48%
Mortgage Type
New Conventional
Create a Home Valuation Report for This Property
The Home Valuation Report is an in-depth analysis detailing your home's value as well as a comparison with similar homes in the area
Home Values in the Area
Average Home Value in this Area
Purchase History
| Date | Buyer | Sale Price | Title Company |
|---|---|---|---|
| Kline Lisa R | -- | Original Title & Escrow Llc | |
| Kline Lisa R | $518,000 | -- |
Source: Public Records
Mortgage History
| Date | Status | Borrower | Loan Amount |
|---|---|---|---|
| Open | Kline Lisa R | $510,400 | |
| Previous Owner | Kline Lisa R | $498,000 |
Source: Public Records
Tax History Compared to Growth
Tax History
| Year | Tax Paid | Tax Assessment Tax Assessment Total Assessment is a certain percentage of the fair market value that is determined by local assessors to be the total taxable value of land and additions on the property. | Land | Improvement |
|---|---|---|---|---|
| 2025 | $9,201 | $822,280 | $373,000 | $449,280 |
| 2024 | $9,201 | $794,190 | $358,000 | $436,190 |
| 2023 | $8,355 | $740,390 | $343,000 | $397,390 |
| 2022 | $7,905 | $691,280 | $323,000 | $368,280 |
| 2021 | $7,494 | $638,610 | $323,000 | $315,610 |
| 2020 | $6,981 | $589,850 | $313,000 | $276,850 |
| 2019 | $6,863 | $579,850 | $303,000 | $276,850 |
| 2018 | $6,553 | $569,850 | $293,000 | $276,850 |
| 2017 | $6,303 | $542,850 | $266,000 | $276,850 |
| 2016 | $6,548 | $565,240 | $253,000 | $312,240 |
| 2015 | $6,308 | $565,240 | $253,000 | $312,240 |
| 2014 | $5,866 | $526,850 | $243,000 | $283,850 |
Source: Public Records
Map
Nearby Homes
- 2960 Vaden Dr Unit 2-406
- 2960 Vaden Dr Unit 2-307
- 2960 Vaden Dr Unit 2-312
- 2960 Vaden Dr Unit 413
- 2903 Saintsbury Plaza Unit 310
- 2903 Saintsbury Plaza Unit 405
- 2905 Saintsbury Plaza Unit 312
- 3003 Mission Square Dr
- 9555 Saintsbury Dr Unit 503
- 9606 Blake Ln
- 0 Blake Ln Blake Ln Service Rd Unit VAFX2167468
- 9720 Five Oaks Rd
- 9523 Bastille St Unit 207
- 3054 Mission Square Dr
- 9713 Kings Crown Ct Unit 1
- 3010 Steven Martin Dr
- 3033 White Birch Ct
- 9715 Kings Crown Ct Unit 202
- 3065 White Birch Ct
- 9730 Kingsbridge Dr Unit 202
- 9542 Bel Glade St
- 3007 Sayre Rd
- 9600 Bel Glade St
- 3006 Sayre Rd
- 9543 Bel Glade St
- 9545 Bel Glade St
- 9541 Bel Glade St
- 9602 Bel Glade St
- 9601 Bel Glade St
- 3004 Sayre Rd
- 9540 Bel Glade St
- 9622 Lindenbrook St
- 9603 Bel Glade St
- 9604 Bel Glade St
- 3017 James St
- 9626 Lindenbrook St
- 9620 Lindenbrook St
- 9628 Lindenbrook St
- 9618 Lindenbrook St
- 3003 Sayre Rd