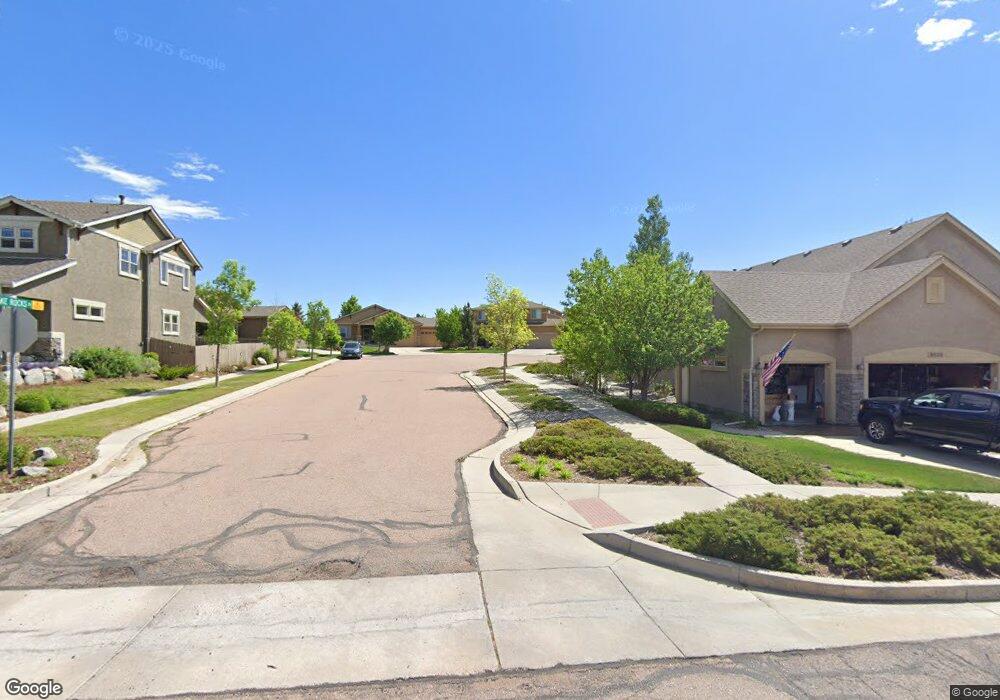
9547 Pancake Rocks Trail Colorado Springs, CO 80924
Wolf Ranch NeighborhoodEstimated Value: $748,000 - $851,000
5
Beds
4
Baths
4,098
Sq Ft
$196/Sq Ft
Est. Value
About This Home
This home is located at 9547 Pancake Rocks Trail, Colorado Springs, CO 80924 and is currently estimated at $801,331, approximately $195 per square foot. 9547 Pancake Rocks Trail is a home located in El Paso County with nearby schools including Chinook Trail Elementary School, Challenger Middle School, and Pine Creek High School.
Ownership History
Date
Name
Owned For
Owner Type
Purchase Details
Closed on
Jul 7, 2021
Sold by
Varner Derrick L and Varner Kara D
Bought by
Stephens Labron Lewis and Stephens Tiffany Evie
Current Estimated Value
Home Financials for this Owner
Home Financials are based on the most recent Mortgage that was taken out on this home.
Original Mortgage
$595,000
Outstanding Balance
$539,870
Interest Rate
2.9%
Mortgage Type
VA
Estimated Equity
$261,461
Purchase Details
Closed on
Jan 31, 2013
Sold by
Livingston Chris P and Livingston Monica E
Bought by
Varner Kara D and Varner Derrick L
Home Financials for this Owner
Home Financials are based on the most recent Mortgage that was taken out on this home.
Original Mortgage
$464,850
Interest Rate
3.42%
Mortgage Type
VA
Purchase Details
Closed on
Sep 29, 2006
Sold by
Vantage Homes Corp
Bought by
Livingston Chris P and Livingston Monica E
Home Financials for this Owner
Home Financials are based on the most recent Mortgage that was taken out on this home.
Original Mortgage
$416,962
Interest Rate
6.51%
Mortgage Type
VA
Create a Home Valuation Report for This Property
The Home Valuation Report is an in-depth analysis detailing your home's value as well as a comparison with similar homes in the area
Home Values in the Area
Average Home Value in this Area
Purchase History
| Date | Buyer | Sale Price | Title Company |
|---|---|---|---|
| Stephens Labron Lewis | $670,000 | Unified Title Co | |
| Varner Kara D | $465,000 | Land Title Guarantee Company | |
| Livingston Chris P | $458,200 | Land Title Guarantee Company |
Source: Public Records
Mortgage History
| Date | Status | Borrower | Loan Amount |
|---|---|---|---|
| Open | Stephens Labron Lewis | $595,000 | |
| Previous Owner | Varner Kara D | $464,850 | |
| Previous Owner | Livingston Chris P | $416,962 |
Source: Public Records
Tax History Compared to Growth
Tax History
| Year | Tax Paid | Tax Assessment Tax Assessment Total Assessment is a certain percentage of the fair market value that is determined by local assessors to be the total taxable value of land and additions on the property. | Land | Improvement |
|---|---|---|---|---|
| 2025 | $2,853 | $53,880 | -- | -- |
| 2024 | $2,843 | $51,250 | $8,040 | $43,210 |
| 2022 | $2,586 | $39,080 | $7,390 | $31,690 |
| 2021 | $2,511 | $40,200 | $7,600 | $32,600 |
| 2020 | $2,712 | $37,410 | $6,610 | $30,800 |
| 2019 | $2,688 | $37,410 | $6,610 | $30,800 |
| 2018 | $2,241 | $32,010 | $5,390 | $26,620 |
| 2017 | $2,236 | $32,010 | $5,390 | $26,620 |
| 2016 | $2,207 | $32,410 | $5,870 | $26,540 |
| 2015 | $2,923 | $32,410 | $5,870 | $26,540 |
| 2014 | $2,736 | $30,280 | $5,600 | $24,680 |
Source: Public Records
Map
Nearby Homes
- 5071 Farris Creek Ct
- 5218 Eldorado Canyon Ct
- 5035 Petrified Forest Trail
- 5019 Petrified Forest Trail
- 4837 Turquoise Lake Ct
- 5420 Paddington Creek Place
- 5359 Mount Cutler Ct
- 5480 Leon Young Dr
- 9131 Lizard Rock Trail
- 4901 Rainbow Gulch Trail
- 9912 San Luis Park Ct
- 6538 Arabesque Loop
- 6579 Arabesque Loop
- 10090 Manhattan Dr
- 9613 Surrey Run Dr
- 5763 Thurber Dr
- 10112 Thrive Ln
- Mountain Plan at Wolf Ranch - Cadence Collection
- Hillside Mesa Duo 5 Plan at Wolf Ranch - Cadence Collection
- Mesa Plan at Wolf Ranch - Cadence Collection
- 9553 Pancake Rocks Trail
- 9541 Pancake Rocks Trail
- 9584 Roxborough Park Ct
- 9574 Roxborough Park Ct
- 9564 Roxborough Park Ct
- 9594 Roxborough Park Ct
- 9559 Pancake Rocks Trail
- 9554 Roxborough Park Ct
- 9535 Pancake Rocks Trail
- 9529 Pancake Rocks Trail
- 9544 Roxborough Park Ct
- 9565 Pancake Rocks Trail
- 9593 Roxborough Park Ct
- 9534 Roxborough Park Ct
- 9571 Pancake Rocks Trail
- 9517 Pancake Rocks Trail
- 9524 Roxborough Park Ct
- 9583 Roxborough Park Ct
- 9563 Roxborough Park Ct
- 9573 Roxborough Park Ct