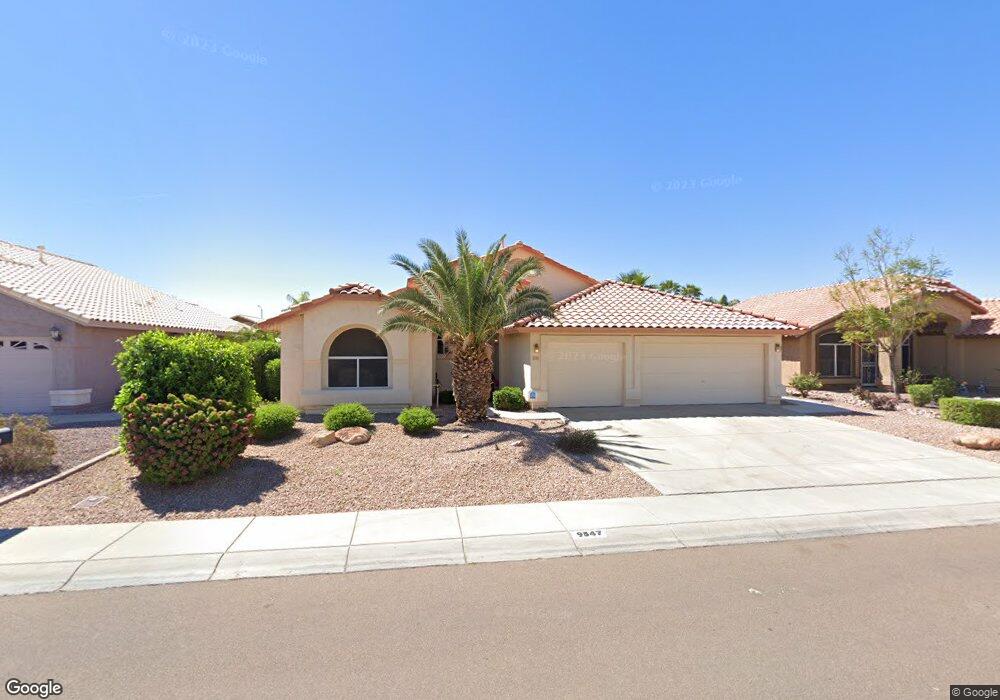
9547 W Ross Ave Peoria, AZ 85382
Estimated Value: $570,152 - $602,000
4
Beds
2
Baths
2,286
Sq Ft
$255/Sq Ft
Est. Value
About This Home
This home is located at 9547 W Ross Ave, Peoria, AZ 85382 and is currently estimated at $583,788, approximately $255 per square foot. 9547 W Ross Ave is a home located in Maricopa County with nearby schools including Parkridge Elementary School and Sunrise Mountain High School.
Ownership History
Date
Name
Owned For
Owner Type
Purchase Details
Closed on
Dec 18, 2019
Sold by
Maderazzo Giro J and Merge Properties Llc
Bought by
Maderazzo Giro J and Giro J Maderazzo Ii Living Tru
Current Estimated Value
Purchase Details
Closed on
Oct 8, 2019
Sold by
Kata Llc
Bought by
Merge Properties Llc
Purchase Details
Closed on
Mar 26, 2019
Sold by
Ravenna Paul J and Ravenna Lois J
Bought by
Kata Llc
Home Financials for this Owner
Home Financials are based on the most recent Mortgage that was taken out on this home.
Original Mortgage
$313,500
Interest Rate
4.3%
Mortgage Type
Seller Take Back
Purchase Details
Closed on
Dec 17, 1998
Sold by
Continental Homes Inc
Bought by
Paddock Daniel W and Paddock Mary R
Home Financials for this Owner
Home Financials are based on the most recent Mortgage that was taken out on this home.
Original Mortgage
$172,900
Interest Rate
6.86%
Mortgage Type
New Conventional
Purchase Details
Closed on
May 28, 1998
Sold by
Chi Construction Company
Bought by
Continental Homes Inc
Create a Home Valuation Report for This Property
The Home Valuation Report is an in-depth analysis detailing your home's value as well as a comparison with similar homes in the area
Home Values in the Area
Average Home Value in this Area
Purchase History
| Date | Buyer | Sale Price | Title Company |
|---|---|---|---|
| Maderazzo Giro J | -- | None Available | |
| Merge Properties Llc | $330,000 | None Available | |
| Kata Llc | $330,000 | Chicago Title Agency Inc | |
| Paddock Daniel W | $163,466 | First American Title | |
| Continental Homes Inc | -- | First American Title |
Source: Public Records
Mortgage History
| Date | Status | Borrower | Loan Amount |
|---|---|---|---|
| Previous Owner | Kata Llc | $313,500 | |
| Previous Owner | Paddock Daniel W | $172,900 |
Source: Public Records
Tax History Compared to Growth
Tax History
| Year | Tax Paid | Tax Assessment Tax Assessment Total Assessment is a certain percentage of the fair market value that is determined by local assessors to be the total taxable value of land and additions on the property. | Land | Improvement |
|---|---|---|---|---|
| 2025 | $2,336 | $30,252 | -- | -- |
| 2024 | $2,775 | $28,812 | -- | -- |
| 2023 | $2,775 | $42,910 | $8,580 | $34,330 |
| 2022 | $2,721 | $32,660 | $6,530 | $26,130 |
| 2021 | $2,849 | $30,220 | $6,040 | $24,180 |
| 2020 | $2,456 | $29,010 | $5,800 | $23,210 |
| 2019 | $2,377 | $26,920 | $5,380 | $21,540 |
| 2018 | $2,698 | $26,100 | $5,220 | $20,880 |
| 2017 | $2,691 | $24,470 | $4,890 | $19,580 |
| 2016 | $2,659 | $23,810 | $4,760 | $19,050 |
| 2015 | $2,474 | $23,870 | $4,770 | $19,100 |
Source: Public Records
Map
Nearby Homes
- 9541 W Frank Ave
- 9529 W Runion Dr
- 9561 W Frank Ave
- 20961 N 96th Dr
- 9651 W Potter Dr
- 9331 W Harmony Ln
- 9457 W Albert Ln
- 20967 N 96th Ln
- 20508 N 93rd Ln
- 9582 W Albert Ln
- 9548 W Quail Ave
- 9574 W Quail Ave
- 9729 W Burnett Rd
- 20424 N 96th Ln
- 9331 W Runion Dr
- 9321 W Clara Ln
- 9250 W Runion Dr
- 9426 W Melinda Ln
- 9225 W Runion Dr
- 9510 W Menadota Dr
- 9541 W Ross Ave
- 9553 W Ross Ave
- 9548 W Potter Dr
- 9554 W Potter Dr
- 9559 W Ross Ave
- 9535 W Ross Ave
- 9548 W Ross Ave
- 9554 W Ross Ave
- 9536 W Potter Dr
- 9560 W Potter Dr
- 9542 W Ross Ave
- 9560 W Ross Ave
- 9565 W Ross Ave
- 9536 W Ross Ave
- 9566 W Potter Dr
- 9566 W Ross Ave
- 9547 W Potter Dr
- 9541 W Potter Dr
- 9553 W Potter Dr