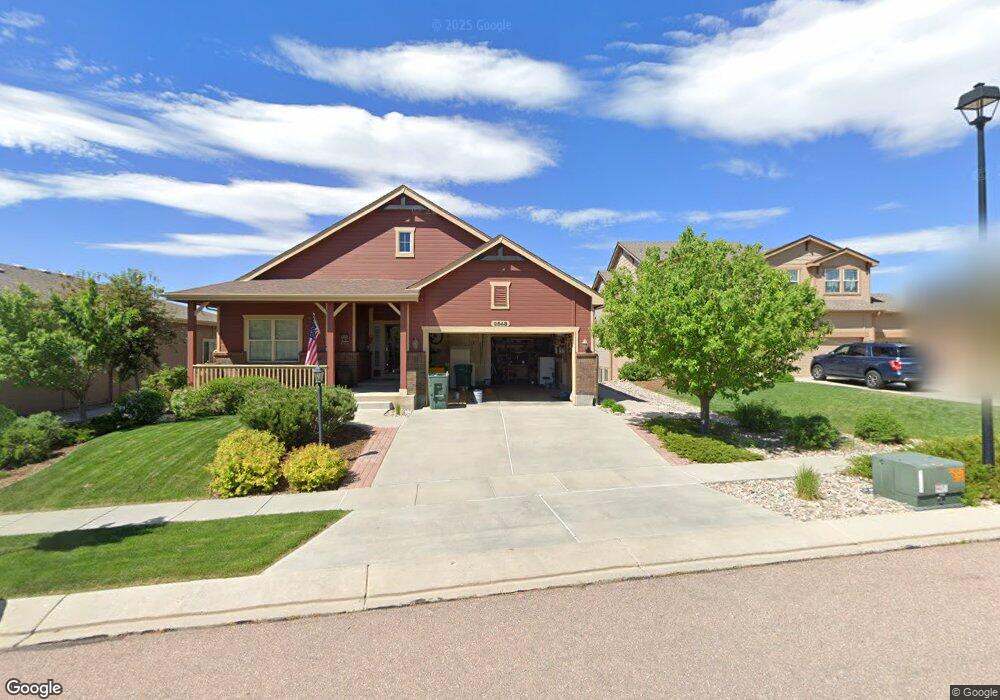
9548 Pancake Rocks Trail Colorado Springs, CO 80924
Wolf Ranch NeighborhoodEstimated Value: $699,000 - $853,000
4
Beds
3
Baths
1,743
Sq Ft
$429/Sq Ft
Est. Value
About This Home
This home is located at 9548 Pancake Rocks Trail, Colorado Springs, CO 80924 and is currently estimated at $747,979, approximately $429 per square foot. 9548 Pancake Rocks Trail is a home located in El Paso County with nearby schools including Chinook Trail Elementary School, Challenger Middle School, and Pine Creek High School.
Ownership History
Date
Name
Owned For
Owner Type
Purchase Details
Closed on
Feb 11, 2020
Sold by
Varley Dwight B and Varley Gabriele R
Bought by
The Varley Family Living Trust
Current Estimated Value
Purchase Details
Closed on
Mar 30, 2007
Sold by
Gill Brent M and Gill Jennifer
Bought by
Varley Dwight B and Varley Gabriele R
Home Financials for this Owner
Home Financials are based on the most recent Mortgage that was taken out on this home.
Original Mortgage
$251,000
Outstanding Balance
$153,009
Interest Rate
6.3%
Mortgage Type
Unknown
Estimated Equity
$594,970
Purchase Details
Closed on
Aug 23, 2006
Sold by
Vantage Homes Corp
Bought by
Gill Brent M and Gill Jennifer
Home Financials for this Owner
Home Financials are based on the most recent Mortgage that was taken out on this home.
Original Mortgage
$315,801
Interest Rate
7.25%
Mortgage Type
New Conventional
Purchase Details
Closed on
Mar 3, 2006
Sold by
Lp47 Llc
Bought by
Vantage Homes Corp
Create a Home Valuation Report for This Property
The Home Valuation Report is an in-depth analysis detailing your home's value as well as a comparison with similar homes in the area
Home Values in the Area
Average Home Value in this Area
Purchase History
| Date | Buyer | Sale Price | Title Company |
|---|---|---|---|
| The Varley Family Living Trust | -- | None Available | |
| Varley Dwight B | $416,000 | Land Title Guarantee Company | |
| Gill Brent M | $394,800 | Land Title Guarantee Company | |
| Vantage Homes Corp | $84,100 | Land Title Guarantee Company |
Source: Public Records
Mortgage History
| Date | Status | Borrower | Loan Amount |
|---|---|---|---|
| Open | Varley Dwight B | $251,000 | |
| Previous Owner | Gill Brent M | $315,801 |
Source: Public Records
Tax History Compared to Growth
Tax History
| Year | Tax Paid | Tax Assessment Tax Assessment Total Assessment is a certain percentage of the fair market value that is determined by local assessors to be the total taxable value of land and additions on the property. | Land | Improvement |
|---|---|---|---|---|
| 2025 | $2,638 | $50,160 | -- | -- |
| 2024 | $2,202 | $47,720 | $8,040 | $39,680 |
| 2022 | $1,982 | $36,900 | $7,390 | $29,510 |
| 2021 | $2,340 | $37,960 | $7,600 | $30,360 |
| 2020 | $2,604 | $36,210 | $6,610 | $29,600 |
| 2019 | $2,581 | $36,210 | $6,610 | $29,600 |
| 2018 | $1,999 | $29,330 | $5,390 | $23,940 |
| 2017 | $2,643 | $29,330 | $5,390 | $23,940 |
| 2016 | $2,803 | $31,050 | $5,870 | $25,180 |
| 2015 | $2,800 | $31,050 | $5,870 | $25,180 |
| 2014 | $2,622 | $29,010 | $5,600 | $23,410 |
Source: Public Records
Map
Nearby Homes
- 5071 Farris Creek Ct
- 4837 Turquoise Lake Ct
- 5035 Petrified Forest Trail
- 5019 Petrified Forest Trail
- 5218 Eldorado Canyon Ct
- 9912 San Luis Park Ct
- 5420 Paddington Creek Place
- 6538 Arabesque Loop
- 6579 Arabesque Loop
- 4901 Rainbow Gulch Trail
- 5359 Mount Cutler Ct
- 9131 Lizard Rock Trail
- 5480 Leon Young Dr
- 10090 Manhattan Dr
- 9613 Surrey Run Dr
- 10025 Waterton Canyon Way
- 4911 Pearl Lake Way
- 5763 Thurber Dr
- 10112 Thrive Ln
- The Everest Plan at The Townes at Cumbre Vista
- 9536 Pancake Rocks Trail
- 9530 Pancake Rocks Trail
- 9572 Pancake Rocks Trail
- 9518 Pancake Rocks Trail
- 9565 Pancake Rocks Trail
- 9535 Pancake Rocks Trail
- 9578 Pancake Rocks Trail
- 9512 Pancake Rocks Trail
- 9529 Pancake Rocks Trail
- 9571 Pancake Rocks Trail
- 9577 Pancake Rocks Trail
- 4893 Young Gulch Way
- 4894 Preachers Hollow Trail
- 9506 Pancake Rocks Trail
- 9517 Pancake Rocks Trail
- 9559 Pancake Rocks Trail
- 4885 Young Gulch Way
- 4886 Preachers Hollow Trail
- 9541 Pancake Rocks Trail
- 9532 Lizard Rock Trail