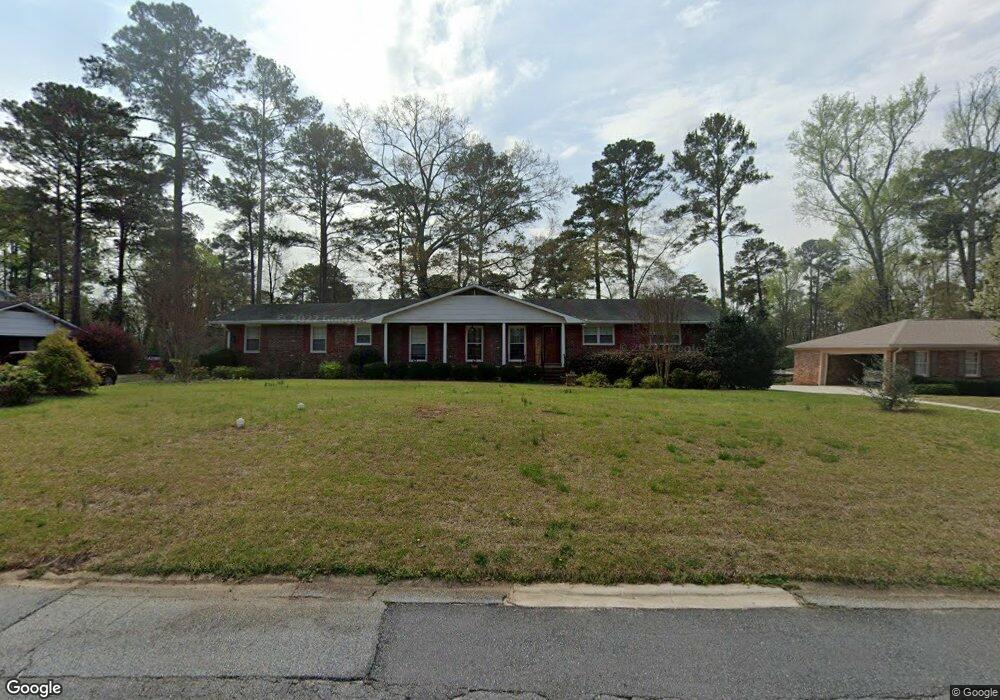
955 Hill Place Macon, GA 31210
Estimated Value: $226,000 - $266,000
3
Beds
3
Baths
1,908
Sq Ft
$125/Sq Ft
Est. Value
About This Home
This home is located at 955 Hill Place, Macon, GA 31210 and is currently estimated at $238,757, approximately $125 per square foot. 955 Hill Place is a home located in Bibb County with nearby schools including Lane Elementary School, Howard Middle School, and Howard High School.
Ownership History
Date
Name
Owned For
Owner Type
Purchase Details
Closed on
Feb 22, 2021
Sold by
Hickman Andrea Gresham and Estate Of Roberta Thasher Geha
Bought by
Hickman Anthony and Hickman Andrea Gresham
Current Estimated Value
Home Financials for this Owner
Home Financials are based on the most recent Mortgage that was taken out on this home.
Original Mortgage
$120,000
Outstanding Balance
$107,639
Interest Rate
3%
Mortgage Type
New Conventional
Estimated Equity
$131,118
Purchase Details
Closed on
Feb 13, 2020
Sold by
Hickman Andrea Gresham
Bought by
Hickman Andrea Gresham and Estate Of Roberta Thrasher Gresham
Purchase Details
Closed on
Apr 15, 2009
Sold by
Roberson Bessie M and Madden Leonard J
Bought by
Gresham Roberta T
Home Financials for this Owner
Home Financials are based on the most recent Mortgage that was taken out on this home.
Original Mortgage
$126,800
Interest Rate
5.18%
Mortgage Type
Unknown
Create a Home Valuation Report for This Property
The Home Valuation Report is an in-depth analysis detailing your home's value as well as a comparison with similar homes in the area
Home Values in the Area
Average Home Value in this Area
Purchase History
| Date | Buyer | Sale Price | Title Company |
|---|---|---|---|
| Hickman Anthony | -- | Better Settlement Svcs Llc | |
| Hickman Andrea Gresham | -- | None Available | |
| Gresham Roberta T | $158,500 | None Available |
Source: Public Records
Mortgage History
| Date | Status | Borrower | Loan Amount |
|---|---|---|---|
| Open | Hickman Anthony | $120,000 | |
| Closed | Gresham Roberta T | $126,800 |
Source: Public Records
Tax History Compared to Growth
Tax History
| Year | Tax Paid | Tax Assessment Tax Assessment Total Assessment is a certain percentage of the fair market value that is determined by local assessors to be the total taxable value of land and additions on the property. | Land | Improvement |
|---|---|---|---|---|
| 2025 | $1,897 | $77,190 | $11,440 | $65,750 |
| 2024 | $1,832 | $72,145 | $11,440 | $60,705 |
| 2023 | $1,640 | $64,578 | $11,440 | $53,138 |
| 2022 | $2,435 | $70,334 | $8,498 | $61,836 |
| 2021 | $2,329 | $61,302 | $7,138 | $54,164 |
| 2020 | $1,779 | $59,687 | $7,138 | $52,549 |
| 2019 | $1,540 | $53,227 | $7,138 | $46,089 |
| 2018 | $2,252 | $48,463 | $6,458 | $42,005 |
| 2017 | $1,177 | $45,596 | $6,821 | $38,775 |
| 2016 | $922 | $41,111 | $6,821 | $34,290 |
| 2015 | $1,311 | $41,111 | $6,821 | $34,290 |
| 2014 | $1,745 | $43,772 | $7,579 | $36,193 |
Source: Public Records
Map
Nearby Homes
- 870 Glen Hill Ct
- 1344 Lake Valley Rd
- 1270 Lake Valley Rd
- 859 Forest Lake Dr S
- 3658 Northside Dr
- 825 Forest Lake Dr S
- 1224 Timberlane Dr
- 1161 Ousley Place
- 3678 Northside Dr
- 4630 Sprucewood Dr
- 4070 Carrie Ct
- 121 Brookstone Way
- 3640 Northside Dr
- 4620 S Stratford Oaks Dr
- 4015 Elnora Dr
- 3622 Northside Dr
- 4653 S Beechwood Dr
- 4661 N Beechwood Dr
- 731 Lokchapee Dr
- 753 Lokchapee Dr
- 947 Hill Place
- 963 Hill Place
- 963 Hill Place Unit B15
- 940 Ousley Place
- 950 Ousley Place
- 928 Ousley Place
- 937 Hill Place
- 971 Hill Place
- 956 Hill Place
- 948 Hill Place
- 964 Hill Place
- 964 Ousley Place
- 918 Ousley Place
- 0 Hill Place Unit 3145814
- 0 Hill Place Unit 8152287
- 0 Hill Place Unit 7085843
- 0 Hill Place Unit 3236785
- 938 Hill Place
- 972 Hill Place
- 925 Hill Place