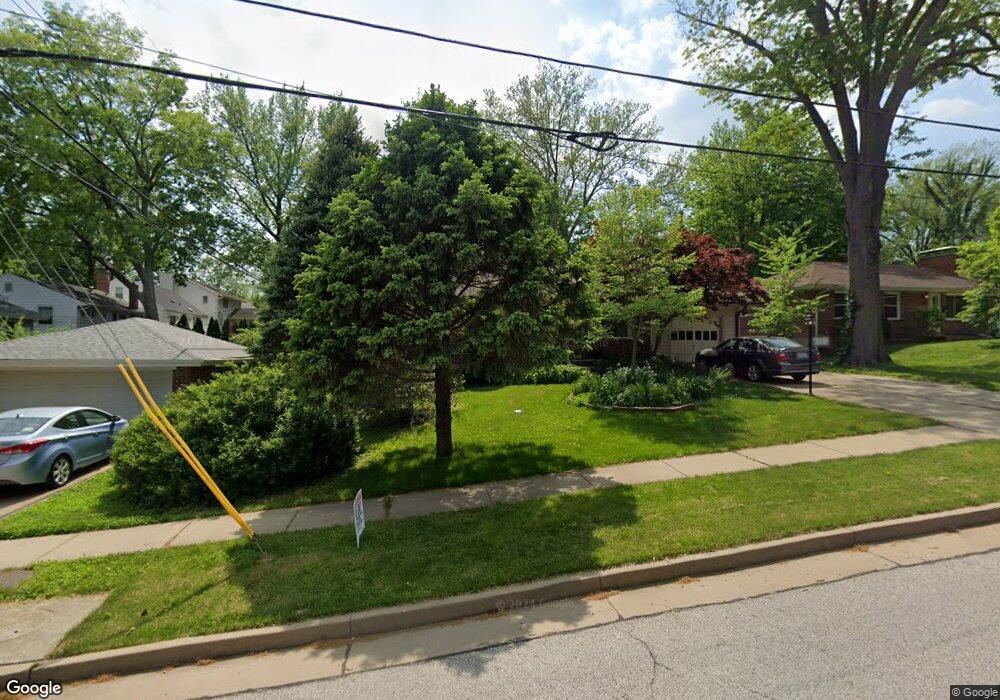
955 Liggett Ave Saint Louis, MO 63126
Estimated Value: $246,000 - $284,000
3
Beds
1
Bath
1,208
Sq Ft
$224/Sq Ft
Est. Value
About This Home
This home is located at 955 Liggett Ave, Saint Louis, MO 63126 and is currently estimated at $270,576, approximately $223 per square foot. 955 Liggett Ave is a home located in St. Louis County with nearby schools including Crestwood Elementary School, Truman Middle School, and Lindbergh High School.
Ownership History
Date
Name
Owned For
Owner Type
Purchase Details
Closed on
Feb 19, 2021
Sold by
Mcginnis Timothy E and Mcginnis Marilyn J
Bought by
Kramer Molly
Current Estimated Value
Home Financials for this Owner
Home Financials are based on the most recent Mortgage that was taken out on this home.
Original Mortgage
$5,800
Outstanding Balance
$5,211
Interest Rate
2.97%
Mortgage Type
New Conventional
Estimated Equity
$265,365
Purchase Details
Closed on
Sep 27, 2019
Sold by
German Robyn M and Mcginnis Timothy F
Bought by
German Robyn M and Mcginnis Timothy F
Purchase Details
Closed on
Mar 25, 2016
Sold by
Mcginnis John M
Bought by
Mcginnis John M
Purchase Details
Closed on
Dec 23, 1997
Sold by
Mcginnis John M and Mcginnis Marilyn J
Bought by
Mcginnis John M and Mcginnis Marilyn J
Create a Home Valuation Report for This Property
The Home Valuation Report is an in-depth analysis detailing your home's value as well as a comparison with similar homes in the area
Home Values in the Area
Average Home Value in this Area
Purchase History
| Date | Buyer | Sale Price | Title Company |
|---|---|---|---|
| Kramer Molly | $149,500 | True Title Company Llc | |
| German Robyn M | -- | None Available | |
| Mcginnis John M | -- | None Available | |
| Mcginnis John M | -- | -- |
Source: Public Records
Mortgage History
| Date | Status | Borrower | Loan Amount |
|---|---|---|---|
| Open | Kramer Molly | $5,800 | |
| Open | Kramer Molly | $145,015 |
Source: Public Records
Tax History Compared to Growth
Tax History
| Year | Tax Paid | Tax Assessment Tax Assessment Total Assessment is a certain percentage of the fair market value that is determined by local assessors to be the total taxable value of land and additions on the property. | Land | Improvement |
|---|---|---|---|---|
| 2025 | $2,943 | $50,030 | $26,620 | $23,410 |
| 2024 | $2,943 | $42,260 | $17,120 | $25,140 |
| 2023 | $2,720 | $42,260 | $17,120 | $25,140 |
| 2022 | $2,939 | $40,700 | $19,000 | $21,700 |
| 2021 | $2,678 | $40,700 | $19,000 | $21,700 |
| 2020 | $2,606 | $38,190 | $17,100 | $21,090 |
| 2019 | $2,600 | $38,190 | $17,100 | $21,090 |
| 2018 | $2,297 | $30,550 | $9,080 | $21,470 |
| 2017 | $2,273 | $30,550 | $9,080 | $21,470 |
| 2016 | $2,105 | $28,650 | $8,130 | $20,520 |
| 2015 | $2,117 | $28,650 | $8,130 | $20,520 |
| 2014 | $2,095 | $28,040 | $7,750 | $20,290 |
Source: Public Records
Map
Nearby Homes
- 1048 Diversey Dr
- 815 Sanders Dr
- 649 S Sappington Rd
- 631 Clover Ln
- 640 Clover Ln
- 9810 Big Bend Blvd
- 614 Conover Ln
- 0 Unknown Unit MIS25067424
- 1353 Webster Path Dr
- 11 Melshire Ct
- 9609 Twincrest Dr
- 432 S Sappington Rd
- 127 Webster Woods Dr
- 1543 Fournier Dr
- 9608 Greenview Dr
- 9405 Vandervoort Ct
- 1637 Ridgewood Dr
- 904 Trellis Ln
- 745 Montego Dr
- 1316 Webster Forest Ct
- 951 Liggett Ave
- 973 Briarton Dr
- 969 Briarton Dr
- 947 Liggett Ave
- 977 Briarton Dr
- 965 Briarton Dr
- 962 Diane Ln
- 961 Briarton Dr
- 964 Diane Ln
- 1001 Ferndale Ave
- 956 Diane Ln
- 957 Briarton Dr
- 941 Liggett Ave
- 950 Diane Ln
- 951 Briarton Dr
- 939 Liggett Ave
- 948 Liggett Ave
- 969 Diane Ln
- 1005 Ferndale Ave
- 940 Liggett Ave