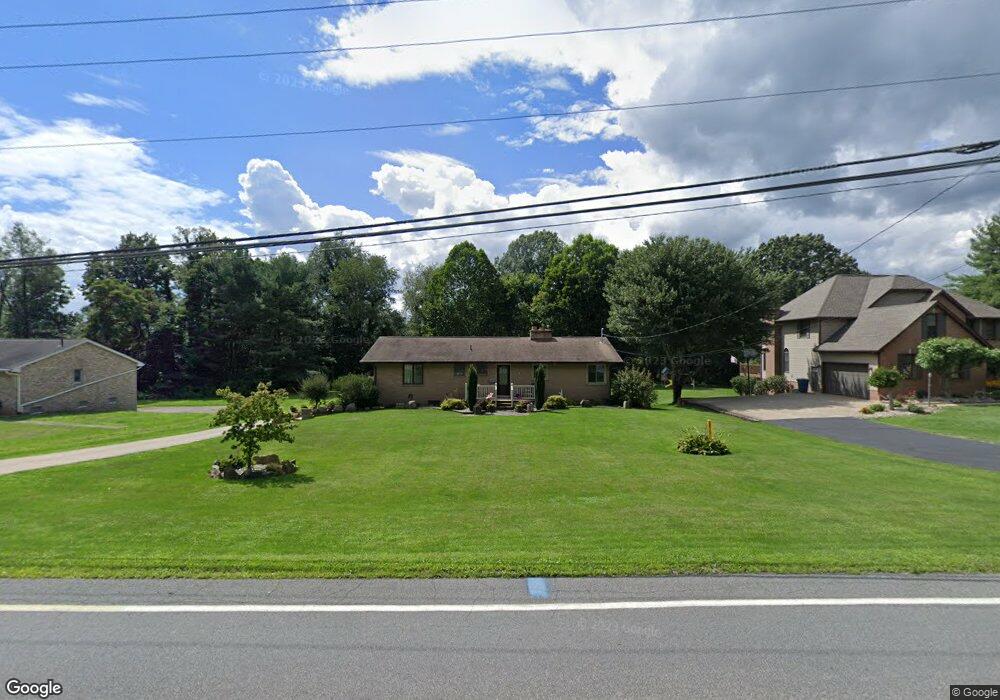
955 Minerva Rd Magnolia, OH 44643
Estimated Value: $209,000 - $253,739
3
Beds
2
Baths
1,400
Sq Ft
$164/Sq Ft
Est. Value
About This Home
This home is located at 955 Minerva Rd, Magnolia, OH 44643 and is currently estimated at $229,185, approximately $163 per square foot. 955 Minerva Rd is a home located in Stark County with nearby schools including Sandy Valley Elementary School, Sandy Valley Middle School, and Sandy Valley High School.
Ownership History
Date
Name
Owned For
Owner Type
Purchase Details
Closed on
Jul 8, 2019
Sold by
Tovissi Andrea K
Bought by
Matthew Tovissi Andrea K and Matthew Tinllin
Current Estimated Value
Home Financials for this Owner
Home Financials are based on the most recent Mortgage that was taken out on this home.
Original Mortgage
$143,500
Outstanding Balance
$124,579
Interest Rate
3.8%
Mortgage Type
New Conventional
Estimated Equity
$104,606
Purchase Details
Closed on
Jan 18, 2016
Sold by
Tovissi Joan
Bought by
Tovissi Andrea K
Purchase Details
Closed on
Dec 21, 2006
Sold by
Tovissi Joan
Bought by
Tovissi Mark R
Purchase Details
Closed on
Nov 9, 2005
Sold by
Estate Of Joseph L Tovissi
Bought by
Tovissi Joan
Create a Home Valuation Report for This Property
The Home Valuation Report is an in-depth analysis detailing your home's value as well as a comparison with similar homes in the area
Purchase History
| Date | Buyer | Sale Price | Title Company |
|---|---|---|---|
| Matthew Tovissi Andrea K | -- | None Available | |
| Tovissi Andrea K | -- | None Available | |
| Tovissi Mark R | -- | Attorney | |
| Tovissi Joan | -- | -- |
Source: Public Records
Mortgage History
| Date | Status | Borrower | Loan Amount |
|---|---|---|---|
| Open | Matthew Tovissi Andrea K | $143,500 |
Source: Public Records
Tax History
| Year | Tax Paid | Tax Assessment Tax Assessment Total Assessment is a certain percentage of the fair market value that is determined by local assessors to be the total taxable value of land and additions on the property. | Land | Improvement |
|---|---|---|---|---|
| 2025 | -- | $85,930 | $26,110 | $59,820 |
| 2024 | -- | $85,930 | $26,110 | $59,820 |
| 2023 | $3,140 | $63,920 | $16,280 | $47,640 |
| 2022 | $3,161 | $63,920 | $16,280 | $47,640 |
| 2021 | $3,184 | $63,920 | $16,280 | $47,640 |
| 2020 | $2,786 | $54,190 | $14,040 | $40,150 |
| 2019 | $2,941 | $54,190 | $14,040 | $40,150 |
| 2018 | $2,982 | $54,190 | $14,040 | $40,150 |
| 2017 | $2,940 | $50,480 | $13,440 | $37,040 |
| 2016 | $2,613 | $44,420 | $13,440 | $30,980 |
| 2015 | $2,642 | $44,420 | $13,440 | $30,980 |
| 2014 | $138 | $34,900 | $10,570 | $24,330 |
| 2013 | $1,075 | $34,900 | $10,570 | $24,330 |
Source: Public Records
Map
Nearby Homes
- 910 Canal St
- 294 Plain St Unit 2
- 5500 Westbrook St SE
- 114 Hemlock Ave
- 121 Wilson Ave
- 0 Goodland St SE
- 5488 Elson St SE
- 117 Market St
- 241 E Lisbon St
- 304 E Lisbon St
- 3640 Hope Rd NW
- 317 Mann Dr
- 0 Elson St SE Unit 5199817
- 390 Ross Dr
- 8009 Waynesburg Dr SE
- 6805 Waynesburg Dr SE
- 11238 Center Dr NE
- 5219 N St NE
- 7115 Lardon Rd NW
- 11652 NE Sandyville Rd NE
- 925 Minerva Rd
- 985 Minerva Rd
- 865 Minerva Rd
- 835 Minerva Rd
- 6535 Minerva Rd SE
- 870 Minerva Rd
- 870 Minerva Rd
- 870 Minerva Rd SE
- 950 Minerva Rd
- 6520 Minerva Rd SE
- 6531 Minerva Rd SE
- 6529 Minerva Rd SE
- 805 Minerva Rd
- 800 Minerva Rd
- 745 Minerva Rd
- 9775 Oaklane Dr SE
- 9839 Oaklane Dr SE
- 9839 Oaklane Dr SE
- 9839 Oaklane Dr SE
- 9795 Oaklane Dr SE
Your Personal Tour Guide
Ask me questions while you tour the home.