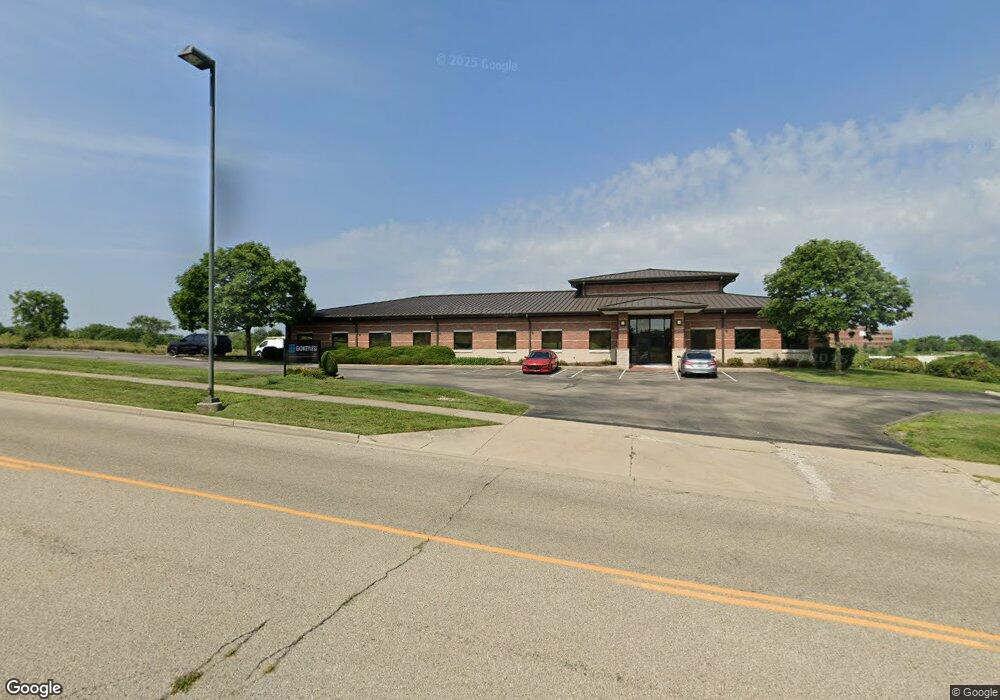
955 Mound Rd Miamisburg, OH 45342
Downtown Miamisburg Neighborhood
--
Bed
--
Bath
12,577
Sq Ft
5.35
Acres
About This Home
This home is located at 955 Mound Rd, Miamisburg, OH 45342. 955 Mound Rd is a home located in Montgomery County with nearby schools including Miamisburg High School and Bethel Baptist School.
Ownership History
Date
Name
Owned For
Owner Type
Purchase Details
Closed on
Dec 19, 2016
Sold by
Boi Solutions Inc
Bought by
Sharpstone Investment Properties Llc
Home Financials for this Owner
Home Financials are based on the most recent Mortgage that was taken out on this home.
Original Mortgage
$320,000
Outstanding Balance
$258,792
Interest Rate
3.57%
Mortgage Type
Future Advance Clause Open End Mortgage
Purchase Details
Closed on
Dec 14, 2012
Sold by
Mound Development Corp
Bought by
Boi Solutions Inc
Create a Home Valuation Report for This Property
The Home Valuation Report is an in-depth analysis detailing your home's value as well as a comparison with similar homes in the area
Home Values in the Area
Average Home Value in this Area
Purchase History
| Date | Buyer | Sale Price | Title Company |
|---|---|---|---|
| Sharpstone Investment Properties Llc | $600,100 | First American Title | |
| Boi Solutions Inc | $695,000 | Home Services Title Llc |
Source: Public Records
Mortgage History
| Date | Status | Borrower | Loan Amount |
|---|---|---|---|
| Open | Sharpstone Investment Properties Llc | $320,000 |
Source: Public Records
Tax History Compared to Growth
Tax History
| Year | Tax Paid | Tax Assessment Tax Assessment Total Assessment is a certain percentage of the fair market value that is determined by local assessors to be the total taxable value of land and additions on the property. | Land | Improvement |
|---|---|---|---|---|
| 2024 | $27,867 | $345,630 | $76,130 | $269,500 |
| 2023 | $27,867 | $345,630 | $76,130 | $269,500 |
| 2022 | $23,196 | $261,840 | $57,670 | $204,170 |
| 2021 | $21,274 | $261,840 | $57,670 | $204,170 |
| 2020 | $20,954 | $261,840 | $57,670 | $204,170 |
| 2019 | $20,551 | $242,610 | $52,430 | $190,180 |
| 2018 | $20,812 | $242,610 | $52,430 | $190,180 |
| 2017 | $20,733 | $242,610 | $52,430 | $190,180 |
| 2016 | $20,673 | $242,610 | $52,430 | $190,180 |
| 2015 | $20,411 | $242,610 | $52,430 | $190,180 |
| 2014 | $20,411 | $242,610 | $52,430 | $190,180 |
Source: Public Records
Map
Nearby Homes