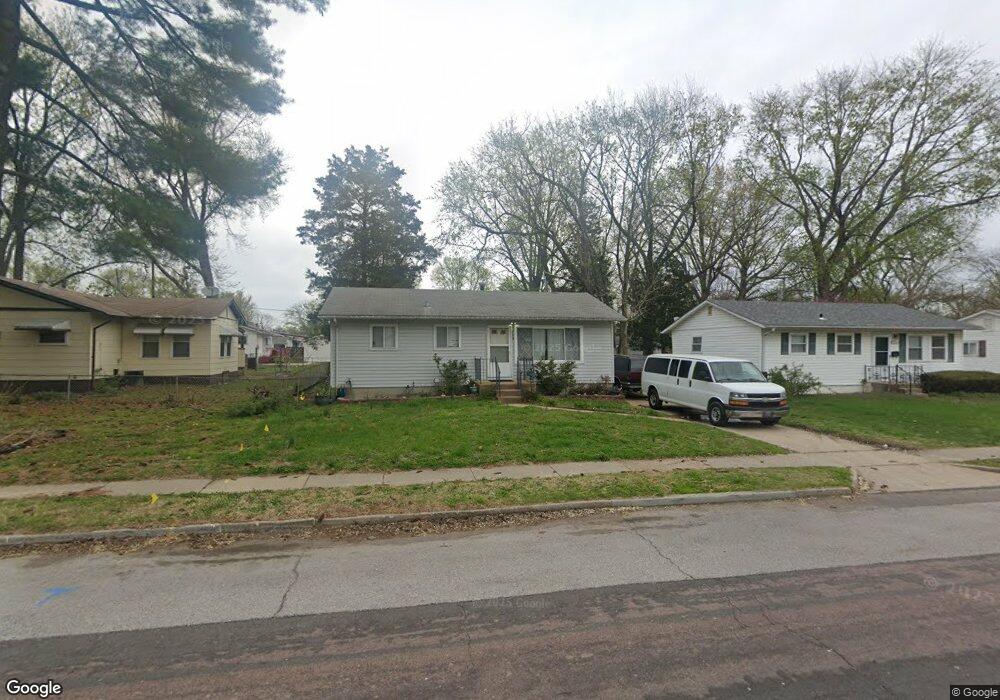
955 Mullanphy Rd Florissant, MO 63031
Estimated Value: $117,000 - $155,000
4
Beds
1
Bath
925
Sq Ft
$151/Sq Ft
Est. Value
About This Home
This home is located at 955 Mullanphy Rd, Florissant, MO 63031 and is currently estimated at $139,748, approximately $151 per square foot. 955 Mullanphy Rd is a home located in St. Louis County with nearby schools including Walker Elementary School, Northwest Middle School, and Hazelwood West High School.
Ownership History
Date
Name
Owned For
Owner Type
Purchase Details
Closed on
Apr 13, 2012
Sold by
Owens Theresa A and Owens Mark H
Bought by
Bisher John M and Bisher Amanda R
Current Estimated Value
Home Financials for this Owner
Home Financials are based on the most recent Mortgage that was taken out on this home.
Original Mortgage
$46,783
Outstanding Balance
$33,051
Interest Rate
4.4%
Mortgage Type
FHA
Estimated Equity
$106,697
Purchase Details
Closed on
Aug 1, 2003
Sold by
Shirley Robert P
Bought by
Owens Theresa A
Create a Home Valuation Report for This Property
The Home Valuation Report is an in-depth analysis detailing your home's value as well as a comparison with similar homes in the area
Home Values in the Area
Average Home Value in this Area
Purchase History
| Date | Buyer | Sale Price | Title Company |
|---|---|---|---|
| Bisher John M | $48,000 | None Available | |
| Owens Theresa A | $17,000 | -- | |
| Owens Theresa A | $17,000 | -- |
Source: Public Records
Mortgage History
| Date | Status | Borrower | Loan Amount |
|---|---|---|---|
| Open | Bisher John M | $46,783 |
Source: Public Records
Tax History Compared to Growth
Tax History
| Year | Tax Paid | Tax Assessment Tax Assessment Total Assessment is a certain percentage of the fair market value that is determined by local assessors to be the total taxable value of land and additions on the property. | Land | Improvement |
|---|---|---|---|---|
| 2025 | $1,909 | $25,850 | $5,420 | $20,430 |
| 2024 | $1,909 | $21,200 | $2,770 | $18,430 |
| 2023 | $1,906 | $21,200 | $2,770 | $18,430 |
| 2022 | $1,752 | $17,350 | $3,100 | $14,250 |
| 2021 | $1,707 | $17,350 | $3,100 | $14,250 |
| 2020 | $1,448 | $13,850 | $2,770 | $11,080 |
| 2019 | $1,427 | $13,850 | $2,770 | $11,080 |
| 2018 | $1,435 | $12,820 | $2,810 | $10,010 |
| 2017 | $1,434 | $12,820 | $2,810 | $10,010 |
| 2016 | $1,293 | $11,380 | $2,430 | $8,950 |
| 2015 | $1,266 | $11,380 | $2,430 | $8,950 |
| 2014 | $1,519 | $14,130 | $3,000 | $11,130 |
Source: Public Records
Map
Nearby Homes
- 890 Tyson Dr
- 1155 Mullanphy Rd
- 1120 Bluebird Dr
- 1150 Verlene Dr
- 685 Mullanphy Rd
- 915 Iris Dr
- 25 Hammes Dr
- 6 Charlotte Dr
- 1445 Vesper Dr
- 1395 Bluebird Dr
- 1480 Vesper Dr
- 1415 Boulder Dr
- 1540 Angelus Dr
- 130 Ruth Dr
- 1700 Patterson Rd
- 1505 Swallow Ln
- 8 Mcnulty Dr
- 660 Crabapple Ln
- 1105 Patterson Rd
- 2186 Aristocrat Dr
- 945 Mullanphy Rd
- 1600 Fernbrook Dr
- 935 Mullanphy Rd
- 1650 Fernbrook Dr
- 1665 Fenmore Dr
- 925 Mullanphy Rd
- 985 Mullanphy Rd
- 950 Mullanphy Rd
- 1000 Mullanphy Rd
- 1660 Fernbrook Dr
- 915 Mullanphy Rd
- 1675 Fenmore Dr
- 920 Mullanphy Rd
- 1635 Fernbrook Dr
- 1006 Aspen Dr
- 995 Mullanphy Rd
- 1670 Fernbrook Dr
- 1625 Tyson Dr
- 1655 Fernbrook Dr
- 1605 Tyson Dr