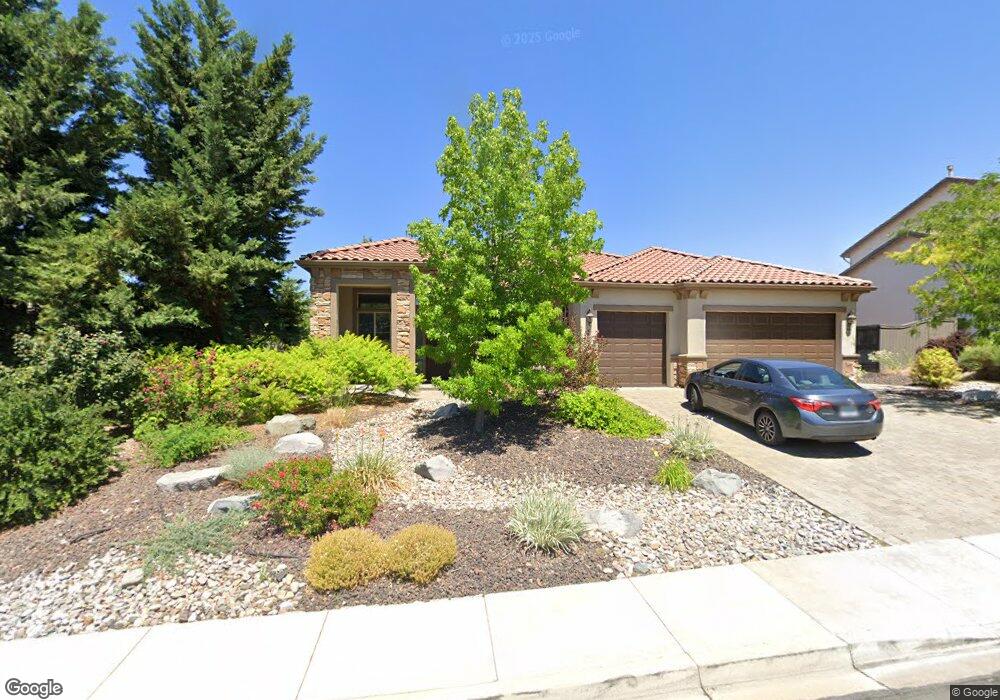
955 N University Park Loop Reno, NV 89512
West University NeighborhoodEstimated Value: $717,124 - $785,000
4
Beds
3
Baths
2,418
Sq Ft
$307/Sq Ft
Est. Value
About This Home
This home is located at 955 N University Park Loop, Reno, NV 89512 and is currently estimated at $743,031, approximately $307 per square foot. 955 N University Park Loop is a home located in Washoe County with nearby schools including Peavine Elementary School, Archie Clayton Pre-AP Academy, and Coral Academy Charter School Elementary.
Ownership History
Date
Name
Owned For
Owner Type
Purchase Details
Closed on
Jan 13, 2022
Sold by
Gardner Shavon S
Bought by
Ssg Family Trust
Current Estimated Value
Purchase Details
Closed on
Feb 16, 2011
Sold by
Gardner William J
Bought by
Gardner Shavon S
Home Financials for this Owner
Home Financials are based on the most recent Mortgage that was taken out on this home.
Original Mortgage
$95,000
Interest Rate
4.74%
Mortgage Type
New Conventional
Purchase Details
Closed on
Aug 2, 2006
Sold by
Lennar Reno Llc
Bought by
Gardner William J and Gardner Shavon S
Home Financials for this Owner
Home Financials are based on the most recent Mortgage that was taken out on this home.
Original Mortgage
$331,000
Interest Rate
6.69%
Mortgage Type
Unknown
Create a Home Valuation Report for This Property
The Home Valuation Report is an in-depth analysis detailing your home's value as well as a comparison with similar homes in the area
Home Values in the Area
Average Home Value in this Area
Purchase History
| Date | Buyer | Sale Price | Title Company |
|---|---|---|---|
| Ssg Family Trust | -- | None Listed On Document | |
| Gardner Shavon S | -- | First Centennial Reno | |
| Gardner William J | $431,500 | North American Title Co |
Source: Public Records
Mortgage History
| Date | Status | Borrower | Loan Amount |
|---|---|---|---|
| Previous Owner | Gardner Shavon S | $95,000 | |
| Previous Owner | Gardner William J | $331,000 |
Source: Public Records
Tax History Compared to Growth
Tax History
| Year | Tax Paid | Tax Assessment Tax Assessment Total Assessment is a certain percentage of the fair market value that is determined by local assessors to be the total taxable value of land and additions on the property. | Land | Improvement |
|---|---|---|---|---|
| 2026 | $2,868 | $173,467 | $46,515 | $126,952 |
| 2025 | $3,719 | $175,215 | $46,515 | $128,700 |
| 2024 | $3,719 | $172,077 | $42,525 | $129,552 |
| 2023 | $3,611 | $166,846 | $44,520 | $122,326 |
| 2022 | $3,677 | $142,515 | $40,845 | $101,670 |
| 2021 | $3,405 | $129,910 | $28,980 | $100,930 |
| 2020 | $3,305 | $132,579 | $31,675 | $100,904 |
| 2019 | $3,208 | $127,893 | $30,625 | $97,268 |
| 2018 | $3,116 | $118,225 | $23,450 | $94,775 |
| 2017 | $3,024 | $116,290 | $21,525 | $94,765 |
| 2016 | $2,949 | $116,890 | $20,125 | $96,765 |
| 2015 | $2,943 | $109,736 | $18,305 | $91,431 |
| 2014 | $2,857 | $94,277 | $15,330 | $78,947 |
| 2013 | -- | $73,444 | $11,410 | $62,034 |
Source: Public Records
Map
Nearby Homes
- 1080 S University Park Loop
- 1120 University Park Ct
- 3715 Coastal St
- 3621 Pimlico St
- 3656 Ruidoso St
- 3510 Comstock Dr
- 3566 Penn National Dr
- 27 Chianti Way
- 29 Chianti Way
- 18 Colombard Way
- 93 Cabernet Pkwy
- 45 Chablis Dr
- 26 S Chardonnay St
- 44 Chablis Dr
- 970 Demos Ct
- 23 Chablis Dr
- 2135 Barberry Way
- 2140 Barberry Way
- 1176 Arrastra Rd Unit Lot 16
- 1172 Arrastra Rd
- 945 N University Park Loop
- 965 N University Park Loop
- 3660 Sienna Vista Ct
- 975 N University Park Loop
- 935 N University Park Loop
- 960 N University Park Loop
- 960 Sienna Park Dr
- 950 N University Park Loop
- 970 N University Park Loop
- 970 Sienna Park Dr
- 940 N University Park Loop
- 930 N University Park Loop
- 980 N University Park Loop
- 3650 Sienna Vista Ct
- 925 N University Park Loop
- 995 N University Park Loop
- 950 Sienna Park Dr Unit 9
- 3560 Rock Ridge Ct
- 865 Sienna Vista Ct
- 880 Sienna Vista Ct