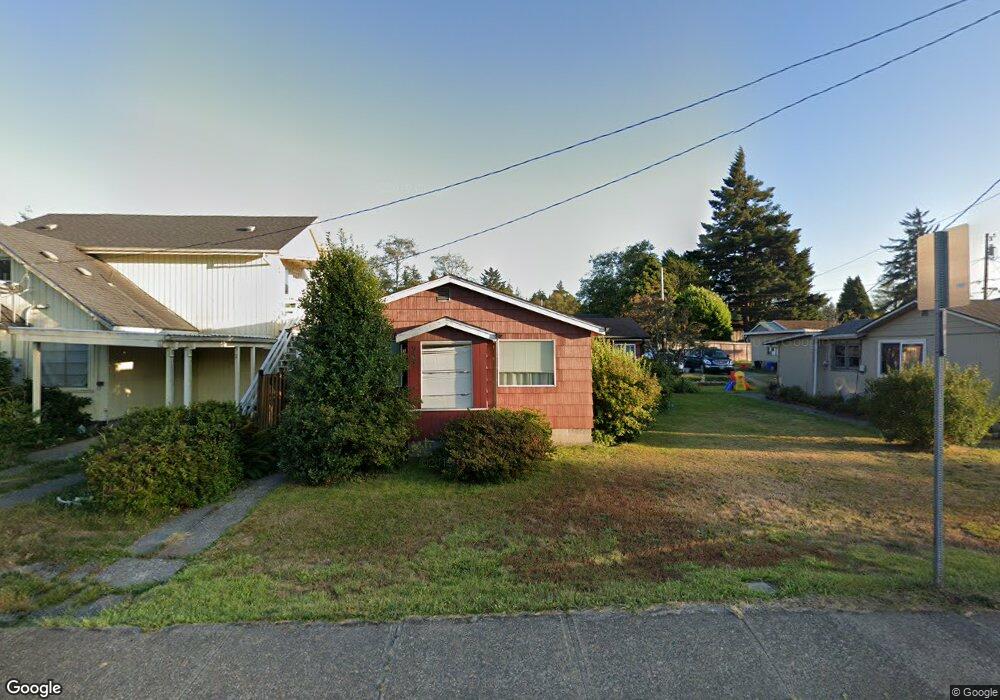
955 Newmark St North Bend, OR 97459
Estimated Value: $197,000 - $237,062
2
Beds
2
Baths
954
Sq Ft
$227/Sq Ft
Est. Value
About This Home
This home is located at 955 Newmark St, North Bend, OR 97459 and is currently estimated at $217,031, approximately $227 per square foot. 955 Newmark St is a home located in Coos County with nearby schools including Hillcrest Elementary School, North Bend Middle School, and North Bend Senior High School.
Ownership History
Date
Name
Owned For
Owner Type
Purchase Details
Closed on
Dec 24, 2013
Sold by
Wade Mitchell W and Jarvis Michelle M
Bought by
Simpkins Stephen D and Simpkins Sara B
Current Estimated Value
Home Financials for this Owner
Home Financials are based on the most recent Mortgage that was taken out on this home.
Original Mortgage
$53,200
Outstanding Balance
$39,935
Interest Rate
4.32%
Mortgage Type
New Conventional
Estimated Equity
$177,096
Purchase Details
Closed on
Oct 26, 2006
Sold by
Basinger Randy and Basinger Jordan Musaeus
Bought by
Wade Mitchell W and Wade Michelle M
Home Financials for this Owner
Home Financials are based on the most recent Mortgage that was taken out on this home.
Original Mortgage
$119,200
Interest Rate
6.39%
Mortgage Type
Purchase Money Mortgage
Purchase Details
Closed on
May 27, 2005
Sold by
Hagen Richard W and Hagen Myra E
Bought by
Basinger Randy and Basinger Jordan
Home Financials for this Owner
Home Financials are based on the most recent Mortgage that was taken out on this home.
Original Mortgage
$76,500
Interest Rate
5.84%
Mortgage Type
Seller Take Back
Create a Home Valuation Report for This Property
The Home Valuation Report is an in-depth analysis detailing your home's value as well as a comparison with similar homes in the area
Home Values in the Area
Average Home Value in this Area
Purchase History
| Date | Buyer | Sale Price | Title Company |
|---|---|---|---|
| Simpkins Stephen D | $66,500 | Multiple | |
| Wade Mitchell W | $149,000 | Fidelity National Title Co | |
| Basinger Randy | $85,000 | First American Title |
Source: Public Records
Mortgage History
| Date | Status | Borrower | Loan Amount |
|---|---|---|---|
| Open | Simpkins Stephen D | $53,200 | |
| Previous Owner | Wade Mitchell W | $119,200 | |
| Previous Owner | Wade Mitchell W | $29,800 | |
| Previous Owner | Basinger Randy | $76,500 |
Source: Public Records
Tax History Compared to Growth
Tax History
| Year | Tax Paid | Tax Assessment Tax Assessment Total Assessment is a certain percentage of the fair market value that is determined by local assessors to be the total taxable value of land and additions on the property. | Land | Improvement |
|---|---|---|---|---|
| 2024 | $1,581 | $102,740 | -- | -- |
| 2023 | $1,534 | $99,750 | $0 | $0 |
| 2022 | $1,518 | $96,850 | $0 | $0 |
| 2021 | $1,555 | $94,030 | $0 | $0 |
| 2020 | $1,457 | $94,030 | $0 | $0 |
| 2019 | $1,393 | $88,650 | $0 | $0 |
| 2018 | $1,354 | $86,070 | $0 | $0 |
| 2017 | $1,317 | $83,570 | $0 | $0 |
| 2016 | $1,277 | $81,140 | $0 | $0 |
| 2015 | $1,189 | $78,780 | $0 | $0 |
| 2014 | $1,189 | $76,490 | $0 | $0 |
Source: Public Records
Map
Nearby Homes
- 3511 Scott Ct
- 00 Exchange St
- 0 Exchange St
- 765 State St
- 760 Oconnell St
- 584 Exchange St
- 0 Sherman Ave Unit 24666250
- 3797 Edgewood Dr
- 3726 Stanton Ave
- 1440 Yew Ave
- 3851 Edgewood Dr
- 0 Newmark St Unit 23622120
- 0 Oconnell Unit 8600 754204062
- 895 Ohio Ave
- 2785 Sherman Ave
- 2728 Sherman Ave
- 2520 Koos Bay Blvd
- 1865 Thompson Rd
- 2719 Alder Ridge Dr
- 2579 Pony Creek Rd
- 961 Newmark St
- 931 Newmark St
- 3410 Liberty St
- 965 Newmark St
- 950 Exchange St
- 3420 Liberty St
- 3455 Chester St
- 950 Newmark St
- 962 Newmark St
- 930 Newmark St
- 3375 Chester St
- 908 Newmark St
- 1009 Newmark St
- 889 Newmark St
- 3376 Chester St
- 955 Exchange St
- 3488 Chester St
- 886 Newmark St
- 953 Commercial St
- 3533 Chester St