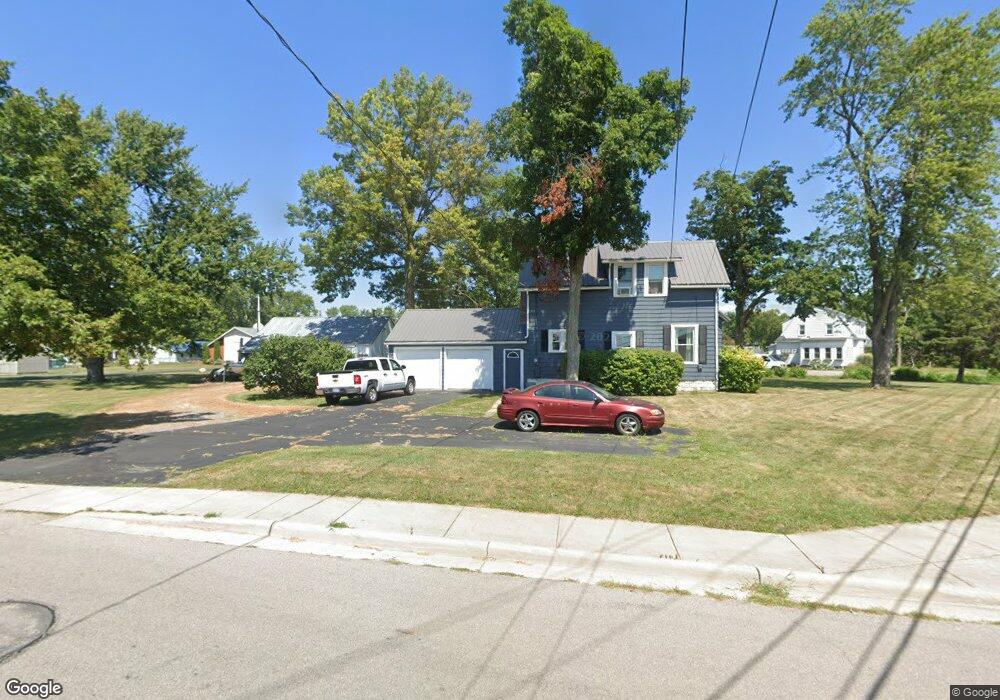
955 S Shannon St van Wert, OH 45891
Estimated Value: $143,000 - $199,000
3
Beds
2
Baths
1,836
Sq Ft
$96/Sq Ft
Est. Value
About This Home
This home is located at 955 S Shannon St, van Wert, OH 45891 and is currently estimated at $177,148, approximately $96 per square foot. 955 S Shannon St is a home located in Van Wert County with nearby schools including Van Wert Early Childhood Center, Van Wert High School, and Lifelinks Community School.
Ownership History
Date
Name
Owned For
Owner Type
Purchase Details
Closed on
Apr 14, 2005
Sold by
Sharp John C and Sharp Miriam E
Bought by
Miller Randy R and Miller Shirley M
Current Estimated Value
Home Financials for this Owner
Home Financials are based on the most recent Mortgage that was taken out on this home.
Original Mortgage
$16,780
Interest Rate
5.89%
Mortgage Type
Stand Alone Second
Purchase Details
Closed on
Apr 24, 2004
Bought by
Fff Properties Llc
Purchase Details
Closed on
Apr 22, 2004
Bought by
Miller Randy R and Miller Shirley
Purchase Details
Closed on
Feb 8, 2002
Bought by
Hsbc Mortgage Services In
Create a Home Valuation Report for This Property
The Home Valuation Report is an in-depth analysis detailing your home's value as well as a comparison with similar homes in the area
Home Values in the Area
Average Home Value in this Area
Purchase History
| Date | Buyer | Sale Price | Title Company |
|---|---|---|---|
| Miller Randy R | $40,700 | None Available | |
| Fff Properties Llc | $42,100 | -- | |
| Miller Randy R | $83,900 | -- | |
| Hsbc Mortgage Services In | -- | -- |
Source: Public Records
Mortgage History
| Date | Status | Borrower | Loan Amount |
|---|---|---|---|
| Closed | Miller Randy R | $16,780 | |
| Open | Miller Randy R | $67,120 |
Source: Public Records
Tax History Compared to Growth
Tax History
| Year | Tax Paid | Tax Assessment Tax Assessment Total Assessment is a certain percentage of the fair market value that is determined by local assessors to be the total taxable value of land and additions on the property. | Land | Improvement |
|---|---|---|---|---|
| 2024 | $1,680 | $49,020 | $9,130 | $39,890 |
| 2023 | $1,680 | $49,020 | $9,130 | $39,890 |
| 2022 | $1,330 | $33,670 | $6,750 | $26,920 |
| 2021 | $1,296 | $33,670 | $6,750 | $26,920 |
| 2020 | $1,293 | $33,670 | $6,750 | $26,920 |
| 2019 | $1,196 | $30,660 | $6,750 | $23,910 |
| 2018 | $1,176 | $30,660 | $6,750 | $23,910 |
| 2017 | $1,166 | $30,660 | $6,750 | $23,910 |
| 2016 | $805 | $21,940 | $6,750 | $15,190 |
| 2015 | $1,107 | $30,170 | $7,120 | $23,050 |
| 2014 | $1,148 | $32,460 | $7,120 | $25,340 |
| 2013 | $1,236 | $32,460 | $7,120 | $25,340 |
Source: Public Records
Map
Nearby Homes