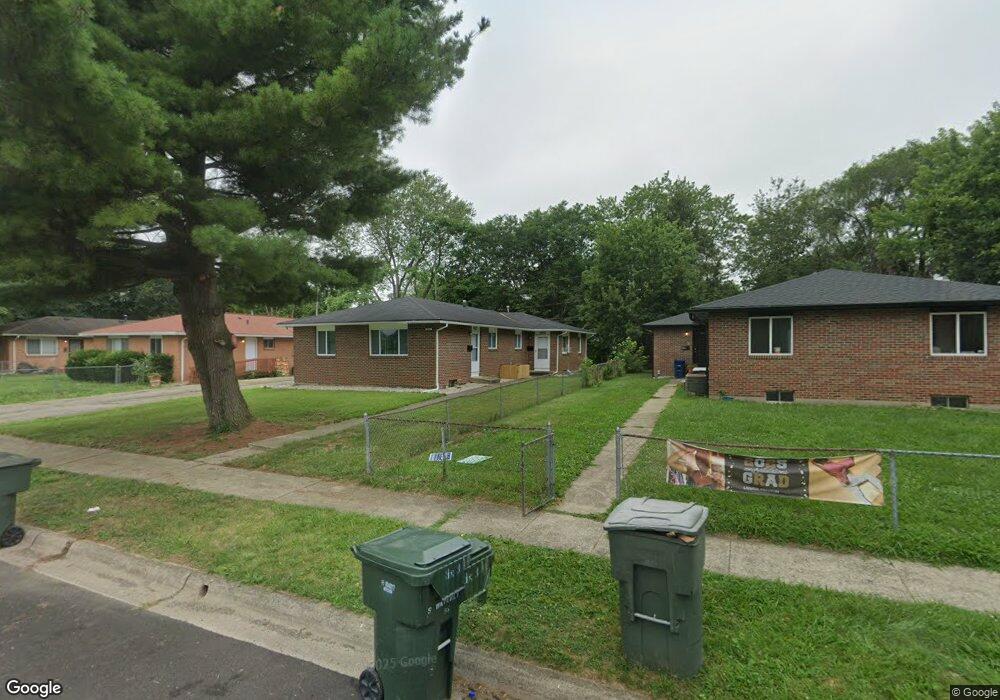
955 S Waverly St Unit 957 Columbus, OH 43227
Eastmoor NeighborhoodEstimated Value: $180,000 - $242,000
5
Beds
3
Baths
1,704
Sq Ft
$121/Sq Ft
Est. Value
About This Home
This home is located at 955 S Waverly St Unit 957, Columbus, OH 43227 and is currently estimated at $206,638, approximately $121 per square foot. 955 S Waverly St Unit 957 is a home located in Franklin County with nearby schools including Fairmoor Elementary School, Johnson Park Middle School, and Walnut Ridge High School.
Ownership History
Date
Name
Owned For
Owner Type
Purchase Details
Closed on
Aug 15, 2019
Sold by
Home Foundry Llc
Bought by
Bradford Properties East Llc
Current Estimated Value
Purchase Details
Closed on
Dec 6, 2010
Sold by
Borders Chirstopher C
Bought by
The Home Foundary Llc
Purchase Details
Closed on
Nov 15, 2007
Sold by
Equity Trust Co
Bought by
Borders Christopher C
Home Financials for this Owner
Home Financials are based on the most recent Mortgage that was taken out on this home.
Original Mortgage
$89,900
Interest Rate
6.3%
Mortgage Type
Purchase Money Mortgage
Purchase Details
Closed on
Jun 19, 2005
Sold by
Northwood Properties Inc
Bought by
Equity Trust Co and Gerald L Bradford Roth Ira
Purchase Details
Closed on
Jun 17, 2005
Sold by
B & B Investment Inc
Bought by
Northwood Properties Inc
Purchase Details
Closed on
Nov 13, 1997
Sold by
Mar Mik Inc
Bought by
B & B Investments Inc
Create a Home Valuation Report for This Property
The Home Valuation Report is an in-depth analysis detailing your home's value as well as a comparison with similar homes in the area
Home Values in the Area
Average Home Value in this Area
Purchase History
| Date | Buyer | Sale Price | Title Company |
|---|---|---|---|
| Bradford Properties East Llc | $63,800 | None Available | |
| The Home Foundary Llc | -- | Amerititle | |
| Borders Christopher C | $89,900 | Amerititle | |
| Equity Trust Co | $81,000 | Amerititle | |
| Northwood Properties Inc | $81,000 | Amerititle | |
| B & B Investments Inc | $63,000 | Transohio Title |
Source: Public Records
Mortgage History
| Date | Status | Borrower | Loan Amount |
|---|---|---|---|
| Previous Owner | Borders Christopher C | $89,900 |
Source: Public Records
Tax History Compared to Growth
Tax History
| Year | Tax Paid | Tax Assessment Tax Assessment Total Assessment is a certain percentage of the fair market value that is determined by local assessors to be the total taxable value of land and additions on the property. | Land | Improvement |
|---|---|---|---|---|
| 2024 | $2,389 | $52,120 | $13,510 | $38,610 |
| 2023 | $2,359 | $52,115 | $13,510 | $38,605 |
| 2022 | $1,423 | $26,780 | $5,290 | $21,490 |
| 2021 | $1,426 | $26,780 | $5,290 | $21,490 |
| 2020 | $1,428 | $26,780 | $5,290 | $21,490 |
| 2019 | $1,389 | $22,330 | $4,410 | $17,920 |
| 2018 | $1,716 | $22,330 | $4,410 | $17,920 |
| 2017 | $1,841 | $22,330 | $4,410 | $17,920 |
| 2016 | $2,269 | $32,280 | $4,730 | $27,550 |
| 2015 | $2,047 | $32,280 | $4,730 | $27,550 |
| 2014 | $2,001 | $32,280 | $4,730 | $27,550 |
| 2013 | $1,045 | $35,840 | $5,250 | $30,590 |
Source: Public Records
Map
Nearby Homes
- 891 S Weyant Ave Unit 893
- 864 S Waverly St
- 1054 S Hampton Rd
- 842 S Hampton Rd
- 3314 Towers Ct S
- 3339 Towers Ct N
- 3325 Towers Ct S
- 804 S Ashburton Rd
- 836 S Weyant Ave
- 3353 Towers Ct S
- 892 Ruby Ave
- 1048 S James Rd
- 3012 Hampshire Rd
- 1077-1079 S James Rd
- 711 S Waverly St
- 708 S Waverly St
- 733 S Napoleon Ave
- 1271 S Weyant Ave
- 635 Elizabeth Ave
- 622 S Ashburton Rd
- 947-949 S Waverly St
- 947 S Waverly St Unit 949
- 961 S Waverly St Unit 963
- 939 S Waverly St
- 967 S Waverly St Unit 969
- 952 S Hampton Rd
- 946 S Hampton Rd
- 935 S Waverly St
- 0 S Waverly St
- 958 S Hampton Rd
- 940 S Hampton Rd
- 975 S Waverly St Unit 977
- 975-977 S Waverly St
- 3251 E Fulton St
- 966 S Hampton Rd
- 932 S Hampton Rd
- 3243 E Fulton St
- 981 S Waverly St
- 981 S Waverly St Unit 981-983
- 981 S Waverly St Unit 981-83