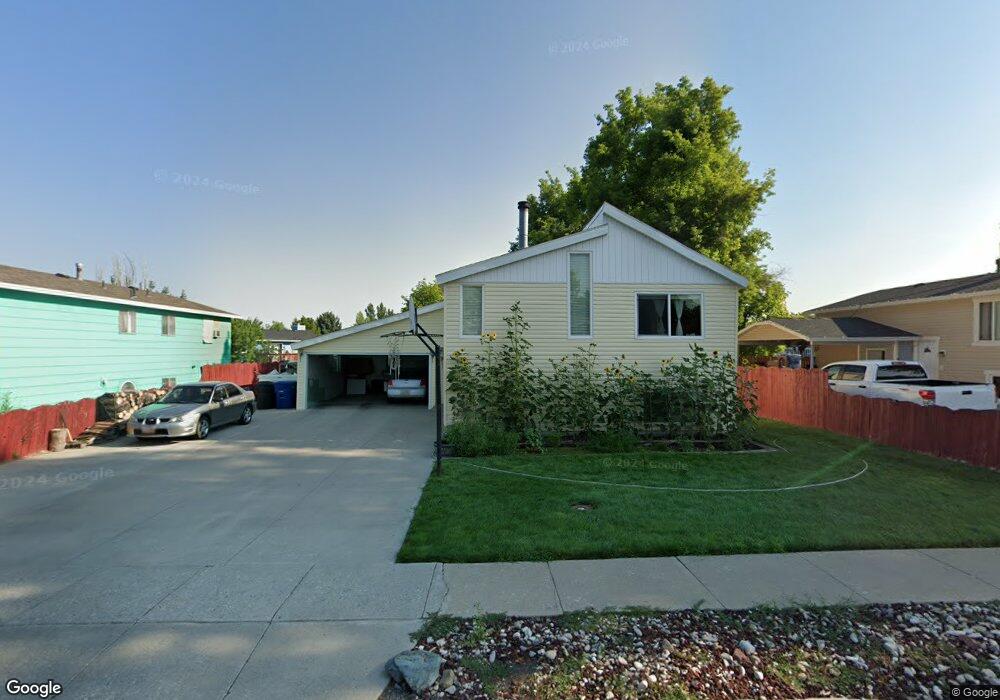
955 W 370 S Logan, UT 84321
Woodruff NeighborhoodEstimated Value: $371,000 - $391,000
5
Beds
2
Baths
2,184
Sq Ft
$176/Sq Ft
Est. Value
About This Home
This home is located at 955 W 370 S, Logan, UT 84321 and is currently estimated at $384,233, approximately $175 per square foot. 955 W 370 S is a home located in Cache County with nearby schools including Woodruff School, Mount Logan Middle School, and Logan High School.
Ownership History
Date
Name
Owned For
Owner Type
Purchase Details
Closed on
Dec 4, 2012
Sold by
Flores Vicente N
Bought by
Flores Vicente N and Flores Diana
Current Estimated Value
Home Financials for this Owner
Home Financials are based on the most recent Mortgage that was taken out on this home.
Original Mortgage
$132,850
Outstanding Balance
$91,342
Interest Rate
3.36%
Mortgage Type
New Conventional
Estimated Equity
$292,891
Purchase Details
Closed on
Mar 19, 2010
Sold by
Bravo Leo A and Bravo Irene N
Bought by
Flores Vicente N and Flores Diana
Home Financials for this Owner
Home Financials are based on the most recent Mortgage that was taken out on this home.
Original Mortgage
$133,438
Interest Rate
5.5%
Mortgage Type
FHA
Create a Home Valuation Report for This Property
The Home Valuation Report is an in-depth analysis detailing your home's value as well as a comparison with similar homes in the area
Home Values in the Area
Average Home Value in this Area
Purchase History
| Date | Buyer | Sale Price | Title Company |
|---|---|---|---|
| Flores Vicente N | -- | Advanced Title | |
| Flores Vicente N | -- | Advanced Title | |
| Flores Vicente N | -- | Advanced Title |
Source: Public Records
Mortgage History
| Date | Status | Borrower | Loan Amount |
|---|---|---|---|
| Open | Flores Vicente N | $132,850 | |
| Closed | Flores Vicente N | $133,438 |
Source: Public Records
Tax History
| Year | Tax Paid | Tax Assessment Tax Assessment Total Assessment is a certain percentage of the fair market value that is determined by local assessors to be the total taxable value of land and additions on the property. | Land | Improvement |
|---|---|---|---|---|
| 2025 | $1,651 | $213,540 | $0 | $0 |
| 2024 | $1,696 | $212,435 | $0 | $0 |
| 2023 | $1,761 | $210,220 | $0 | $0 |
| 2022 | $1,565 | $174,470 | $0 | $0 |
| 2021 | $1,477 | $254,400 | $45,000 | $209,400 |
| 2020 | $1,416 | $219,500 | $45,000 | $174,500 |
| 2019 | $1,267 | $187,864 | $45,000 | $142,864 |
| 2018 | $1,226 | $166,072 | $45,000 | $121,072 |
| 2017 | $1,115 | $79,805 | $0 | $0 |
| 2016 | $1,156 | $79,805 | $0 | $0 |
| 2015 | $1,157 | $79,805 | $0 | $0 |
| 2014 | $857 | $65,430 | $0 | $0 |
| 2013 | -- | $65,430 | $0 | $0 |
Source: Public Records
Map
Nearby Homes
- 952 W 330 S
- 1400 S 940 W
- 1031 W 350 S
- 207 Sunstone Cir
- 1099 Three Pointe Ave
- 501 Southwest St
- 370 S 1200 W Unit 2
- 553 Center Ave
- 508 S 1215 W Unit 144
- 539 S 1215 W Unit 129
- 551 S 1215 W Unit 131
- 1204 W 575 S
- 1214 W 575 S
- 1210 W 575 S Unit 163
- 1210 W 575 S
- 245 S 1280 W
- 1239 W 575 S
- 562 S 1215 W Unit 135
- 226 S 600 W
- 1615 Silver Canoe Way
Your Personal Tour Guide
Ask me questions while you tour the home.