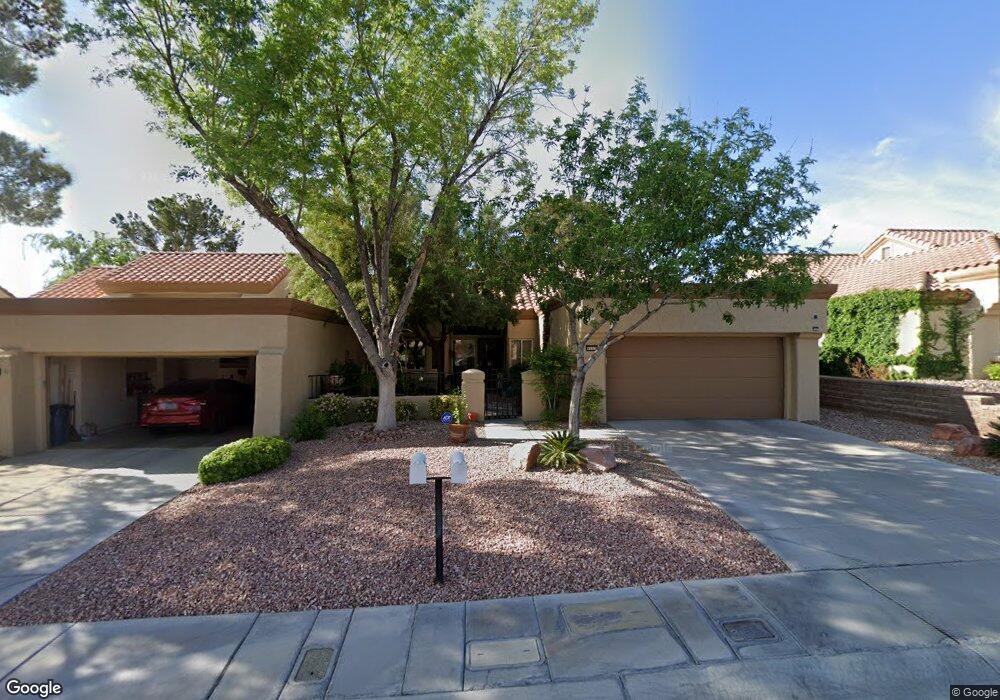
9553 Eagle Valley Dr Las Vegas, NV 89134
Sun City Summerlin NeighborhoodEstimated Value: $415,000 - $444,000
2
Beds
2
Baths
1,359
Sq Ft
$318/Sq Ft
Est. Value
About This Home
This home is located at 9553 Eagle Valley Dr, Las Vegas, NV 89134 and is currently estimated at $432,558, approximately $318 per square foot. 9553 Eagle Valley Dr is a home located in Clark County with nearby schools including William Lummis Elementary School, Ernest Becker Middle School, and Palo Verde High School.
Ownership History
Date
Name
Owned For
Owner Type
Purchase Details
Closed on
Feb 27, 2014
Sold by
Elsinore Ii Llc
Bought by
Groth William E
Current Estimated Value
Purchase Details
Closed on
Feb 18, 2014
Sold by
Jordan William L and Jordan Charlotte M
Bought by
Doane Patricia A
Purchase Details
Closed on
Oct 1, 2009
Sold by
Taylor Walter and Taylor Geraldine A
Bought by
Jordan William L and Jordan Charlotte M
Home Financials for this Owner
Home Financials are based on the most recent Mortgage that was taken out on this home.
Original Mortgage
$191,105
Interest Rate
5.02%
Mortgage Type
VA
Purchase Details
Closed on
Nov 14, 1995
Sold by
Rogers Thomas L
Bought by
Rogers Thomas L
Purchase Details
Closed on
Jan 4, 1994
Sold by
Rogers Thomas L and Baird Kasmere
Bought by
Rogers Thomas L
Create a Home Valuation Report for This Property
The Home Valuation Report is an in-depth analysis detailing your home's value as well as a comparison with similar homes in the area
Home Values in the Area
Average Home Value in this Area
Purchase History
| Date | Buyer | Sale Price | Title Company |
|---|---|---|---|
| Groth William E | $225,000 | National Title Co | |
| Doane Patricia A | $165,505 | National Title Co | |
| Jordan William L | $185,000 | Ticor Title Las Vegas | |
| Rogers Thomas L | -- | -- | |
| Rogers Thomas L | -- | -- |
Source: Public Records
Mortgage History
| Date | Status | Borrower | Loan Amount |
|---|---|---|---|
| Previous Owner | Jordan William L | $191,105 |
Source: Public Records
Tax History Compared to Growth
Tax History
| Year | Tax Paid | Tax Assessment Tax Assessment Total Assessment is a certain percentage of the fair market value that is determined by local assessors to be the total taxable value of land and additions on the property. | Land | Improvement |
|---|---|---|---|---|
| 2025 | $3,306 | $104,681 | $58,800 | $45,881 |
| 2024 | $2,832 | $104,681 | $58,800 | $45,881 |
| 2023 | $2,832 | $97,443 | $54,950 | $42,493 |
| 2022 | $2,533 | $90,587 | $50,050 | $40,537 |
| 2021 | $2,345 | $81,778 | $48,300 | $33,478 |
| 2020 | $2,175 | $83,043 | $47,950 | $35,093 |
| 2019 | $2,038 | $80,495 | $45,500 | $34,995 |
| 2018 | $1,945 | $76,931 | $43,225 | $33,706 |
| 2017 | $2,412 | $72,726 | $39,725 | $33,001 |
| 2016 | $1,821 | $58,699 | $24,850 | $33,849 |
| 2015 | $1,817 | $56,086 | $22,750 | $33,336 |
| 2014 | $1,760 | $53,655 | $22,400 | $31,255 |
Source: Public Records
Map
Nearby Homes
- 9536 Eagle Valley Dr Unit 22
- 9532 Sundial Dr
- 9509 Sundial Dr
- 9536 Ruby Hills Dr
- 9525 Salem Hills Ct
- 2732 Tumble Brook Dr
- 9424 Gold Mountain Dr
- 2821 Tumble Brook Dr
- 2837 Billy Casper Dr
- 2712 Lotus Hill Dr
- 2428 Sterling Heights Dr
- 2532 Big Timber Dr
- 9400 Grand Mesa Dr
- 9729 Buckhorn Dr
- 9705 Blue Bell Dr
- 2916 Hawksdale Dr
- 2725 Youngdale Dr
- 9701 Ann Arbor Ln
- 9413 Cedar Heights Ave Unit 2
- 2913 Billy Casper Dr
- 9549 Eagle Valley Dr
- 9601 Eagle Valley Dr
- 9605 Eagle Valley Dr
- 9541 Eagle Valley Dr
- 9552 Eagle Valley Dr Unit 22
- 9600 Eagle Valley Dr
- 9548 Eagle Valley Dr
- 9604 Eagle Valley Dr Unit 22
- 9537 Eagle Valley Dr
- 9544 Eagle Valley Dr
- 9533 Eagle Valley Dr
- 9608 Eagle Valley Dr
- 9553 Gold Bank Dr
- 9601 Gold Bank Dr
- 9601 Gold Bank Dr Unit 22
- 9549 Gold Bank Dr
- 9605 Gold Bank Dr
- 9613 Eagle Valley Dr
- 9529 Eagle Valley Dr
- 9541 Gold Bank Dr