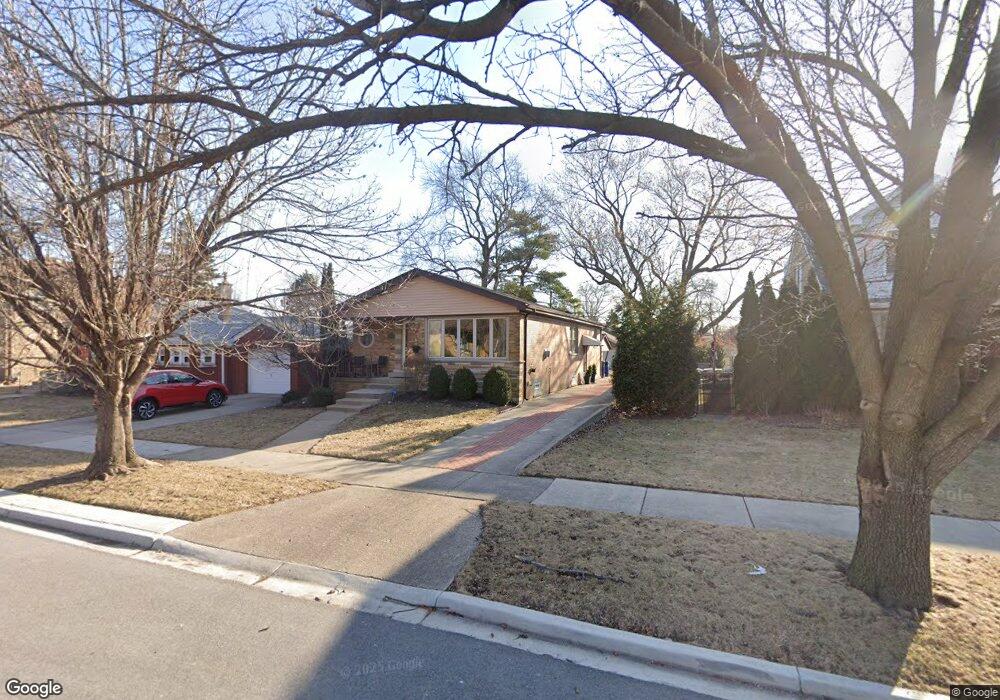
9553 S Harding Ave Evergreen Park, IL 60805
Estimated Value: $310,000 - $394,000
4
Beds
3
Baths
1,496
Sq Ft
$235/Sq Ft
Est. Value
About This Home
This home is located at 9553 S Harding Ave, Evergreen Park, IL 60805 and is currently estimated at $351,902, approximately $235 per square foot. 9553 S Harding Ave is a home located in Cook County with nearby schools including Southwest Elementary School, Central Jr High School, and Evergreen Park High School.
Ownership History
Date
Name
Owned For
Owner Type
Purchase Details
Closed on
Dec 9, 2014
Sold by
Gainer Joanne S
Bought by
Gainer Joanne S and Joanne S Gainer Trust
Current Estimated Value
Home Financials for this Owner
Home Financials are based on the most recent Mortgage that was taken out on this home.
Original Mortgage
$50,000
Outstanding Balance
$16,959
Interest Rate
3.94%
Mortgage Type
New Conventional
Estimated Equity
$334,943
Purchase Details
Closed on
Nov 20, 2014
Sold by
Gainer Joanne S and Blake Joanne S
Bought by
Gainer Joanne S
Home Financials for this Owner
Home Financials are based on the most recent Mortgage that was taken out on this home.
Original Mortgage
$50,000
Outstanding Balance
$16,959
Interest Rate
3.94%
Mortgage Type
New Conventional
Estimated Equity
$334,943
Purchase Details
Closed on
Dec 30, 1993
Sold by
Peterson Edward L and Peterson Valerie M
Bought by
Bartz Craig A and Bartz Donna M
Home Financials for this Owner
Home Financials are based on the most recent Mortgage that was taken out on this home.
Original Mortgage
$120,000
Interest Rate
7.32%
Create a Home Valuation Report for This Property
The Home Valuation Report is an in-depth analysis detailing your home's value as well as a comparison with similar homes in the area
Home Values in the Area
Average Home Value in this Area
Purchase History
| Date | Buyer | Sale Price | Title Company |
|---|---|---|---|
| Gainer Joanne S | -- | Attorney | |
| Gainer Joanne S | -- | Servicelink | |
| Bartz Craig A | $101,666 | -- |
Source: Public Records
Mortgage History
| Date | Status | Borrower | Loan Amount |
|---|---|---|---|
| Open | Gainer Joanne S | $50,000 | |
| Previous Owner | Bartz Craig A | $120,000 |
Source: Public Records
Tax History Compared to Growth
Tax History
| Year | Tax Paid | Tax Assessment Tax Assessment Total Assessment is a certain percentage of the fair market value that is determined by local assessors to be the total taxable value of land and additions on the property. | Land | Improvement |
|---|---|---|---|---|
| 2024 | $7,520 | $28,000 | $3,472 | $24,528 |
| 2023 | $6,316 | $28,000 | $3,472 | $24,528 |
| 2022 | $6,316 | $22,115 | $2,976 | $19,139 |
| 2021 | $6,163 | $22,115 | $2,976 | $19,139 |
| 2020 | $6,084 | $22,115 | $2,976 | $19,139 |
| 2019 | $6,079 | $21,827 | $2,728 | $19,099 |
| 2018 | $3,290 | $21,827 | $2,728 | $19,099 |
| 2017 | $8,169 | $21,827 | $2,728 | $19,099 |
| 2016 | $4,401 | $16,175 | $2,232 | $13,943 |
| 2015 | $4,633 | $16,175 | $2,232 | $13,943 |
| 2014 | $5,909 | $19,668 | $2,232 | $17,436 |
| 2013 | $6,376 | $22,358 | $2,232 | $20,126 |
Source: Public Records
Map
Nearby Homes
- 9609 S Komensky Ave Unit 204
- 3900 W 95th St Unit 303
- 9701 S Springfield Ave
- 9620 S Komensky Ave Unit 305
- 9601 S Karlov Ave Unit 104
- 9725 S Karlov Ave Unit 610
- 9725 S Karlov Ave Unit 501
- 9725 S Karlov Ave Unit 401
- 9725 S Karlov Ave Unit 402
- 9720 S Pulaski Rd Unit 306
- 9720 S Pulaski Rd Unit 502
- 9720 S Pulaski Rd Unit 602
- 9740 S Pulaski Rd Unit 9740306
- 9740 S Pulaski Rd Unit 107
- 9745 S Karlov Ave Unit 607
- 9720 S Karlov Ave Unit 202
- 9716 S Karlov Ave Unit 307
- 9716 S Karlov Ave Unit 203
- 4125 W 97th Place Unit 206
- 9820 S Pulaski Rd Unit 213
- 9537 S Harding Ave
- 9537 S Harding Ave
- 9559 S Harding Ave
- 9531 S Harding Ave
- 9550 S Springfield Ave
- 9556 S Springfield Ave
- 9529 S Harding Ave
- 9546 S Springfield Ave
- 9560 S Springfield Ave
- 9601 S Harding Ave
- 9601 S Harding Ave
- 9544 S Springfield Ave
- 9527 S Harding Ave
- 9550 S Harding Ave
- 9550 S Harding Ave
- 9542 S Harding Ave
- 9534 S Springfield Ave
- 9556 S Harding Ave
- 9536 S Harding Ave
- 9532 S Springfield Ave