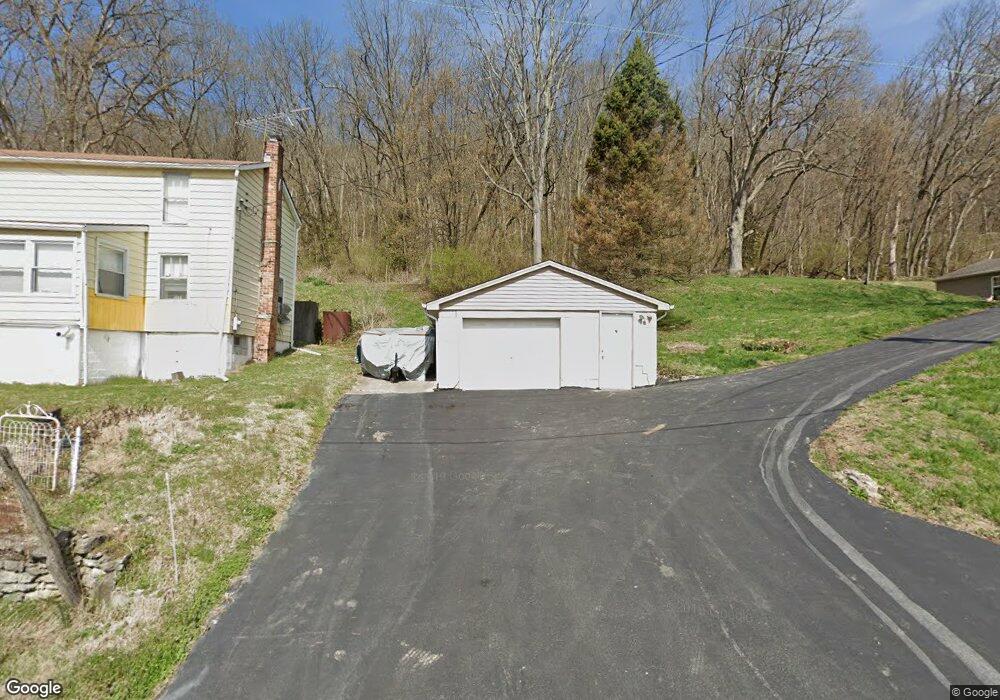
9554 Brower Rd North Bend, OH 45052
Estimated Value: $88,561 - $172,000
--
Bed
--
Bath
--
Sq Ft
10,062
Sq Ft Lot
About This Home
This home is located at 9554 Brower Rd, North Bend, OH 45052 and is currently estimated at $122,187. 9554 Brower Rd is a home located in Hamilton County with nearby schools including Charles T. Young Elementary School, Taylor Middle School, and Taylor High School.
Ownership History
Date
Name
Owned For
Owner Type
Purchase Details
Closed on
Sep 1, 2022
Sold by
Espich Dennis J and Espich Mildred K
Bought by
Beckmeyer Francis J
Current Estimated Value
Purchase Details
Closed on
Nov 16, 2010
Sold by
Lacey Jessica R and Lacey Matthew T
Bought by
Federal Home Loan Mortgage Corporation
Purchase Details
Closed on
May 10, 2007
Sold by
Eden William N and Eden Paula
Bought by
Lacey Matthew T and Lacey Jessica R
Home Financials for this Owner
Home Financials are based on the most recent Mortgage that was taken out on this home.
Original Mortgage
$114,375
Interest Rate
6.21%
Mortgage Type
Unknown
Purchase Details
Closed on
Jul 26, 2006
Sold by
Fannie Mae
Bought by
Edens William N and Edens Paula
Purchase Details
Closed on
Mar 28, 2006
Sold by
Kallschmidt Susan E
Bought by
Federal National Mortgage Association
Create a Home Valuation Report for This Property
The Home Valuation Report is an in-depth analysis detailing your home's value as well as a comparison with similar homes in the area
Home Values in the Area
Average Home Value in this Area
Purchase History
| Date | Buyer | Sale Price | Title Company |
|---|---|---|---|
| Beckmeyer Francis J | $115,000 | Rivertowne Title | |
| Federal Home Loan Mortgage Corporation | $78,000 | Attorney | |
| Lacey Matthew T | $152,500 | Attorney | |
| Edens William N | $20,500 | None Available | |
| Federal National Mortgage Association | $28,000 | None Available |
Source: Public Records
Mortgage History
| Date | Status | Borrower | Loan Amount |
|---|---|---|---|
| Previous Owner | Lacey Matthew T | $114,375 |
Source: Public Records
Tax History Compared to Growth
Tax History
| Year | Tax Paid | Tax Assessment Tax Assessment Total Assessment is a certain percentage of the fair market value that is determined by local assessors to be the total taxable value of land and additions on the property. | Land | Improvement |
|---|---|---|---|---|
| 2024 | $234 | $4,736 | $3,175 | $1,561 |
| 2023 | $230 | $4,736 | $3,175 | $1,561 |
| 2022 | $303 | $4,904 | $3,105 | $1,799 |
| 2021 | $302 | $4,904 | $3,105 | $1,799 |
| 2020 | $297 | $4,904 | $3,105 | $1,799 |
| 2019 | $271 | $4,120 | $2,608 | $1,512 |
| 2018 | $261 | $4,120 | $2,608 | $1,512 |
| 2017 | $248 | $4,120 | $2,608 | $1,512 |
| 2016 | $288 | $4,855 | $2,790 | $2,065 |
| 2015 | $286 | $4,855 | $2,790 | $2,065 |
| 2014 | $289 | $4,855 | $2,790 | $2,065 |
| 2013 | $264 | $4,537 | $2,608 | $1,929 |
Source: Public Records
Map
Nearby Homes
- 2700 Rittenhouse Rd
- 36 Timberline Ct
- 7284 W Harrison Ave
- 143 Mount Nebo Rd
- 118 Mount Nebo Rd
- 100 Mount Nebo Rd
- 21 Wamsley Ave
- 9807 Miamiview Rd
- 42 Edinburgh Place Unit 42
- 101 E State Rd
- 110 Elliott St
- 0 Saint Annes Unit 1826785
- 9750 Hooven Ave
- 301 N Miami Ave
- 540 Aston View Ln
- 10451 Dugan Gap Rd
- 108 Scott St
- The Jefferson Plan at North Pointe
- The Bristol Plan at North Pointe
- The Austin Plan at North Pointe
- 9576 Brower Rd
- 9582 Brower Rd
- 9586 Brower Rd
- 9540 Brower Rd
- 9514 Brower Rd
- 9604 Brower Rd
- 9510 Brower Rd
- 9608 Brower Rd
- 9614 Brower Rd
- 2679 Cliff Rd
- 9618 Brower Rd
- 2689 Cliff Rd
- 2655 Cliff Rd
- 2701 Cliff Rd
- 9506 Brower Rd
- 9622 Brower Rd
- 4167 Alexandras Ridge Dr
- 9 Tisch Estates
- 6 Tisch Estates
- 10 Tisch Estates