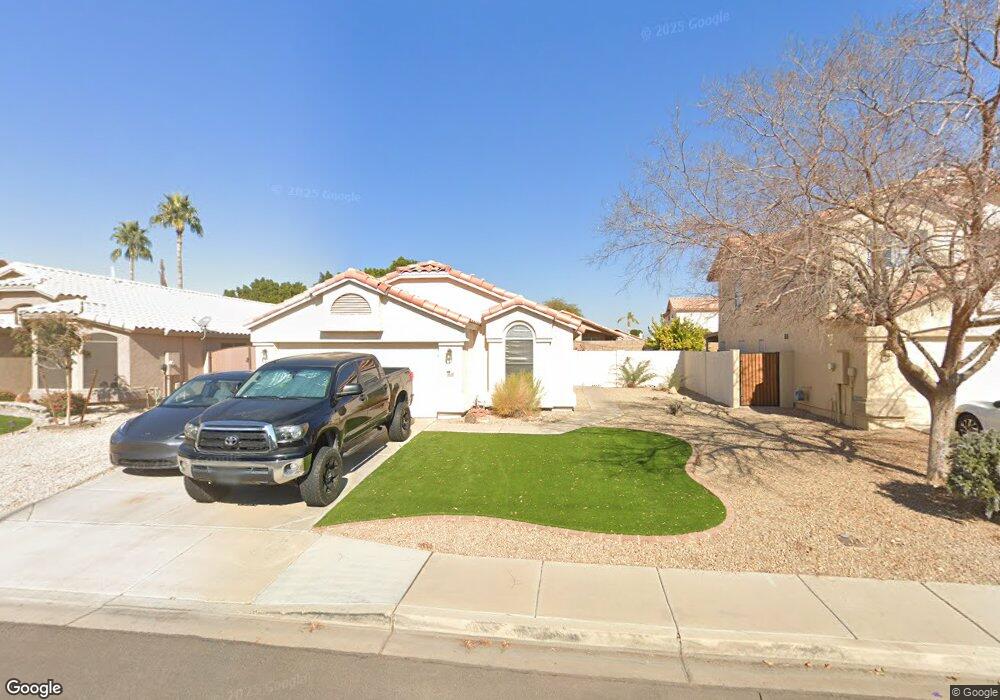
9554 W Runion Dr Peoria, AZ 85382
Estimated Value: $341,493 - $420,000
--
Bed
3
Baths
1,283
Sq Ft
$304/Sq Ft
Est. Value
About This Home
This home is located at 9554 W Runion Dr, Peoria, AZ 85382 and is currently estimated at $390,373, approximately $304 per square foot. 9554 W Runion Dr is a home located in Maricopa County with nearby schools including Parkridge Elementary School and Sunrise Mountain High School.
Ownership History
Date
Name
Owned For
Owner Type
Purchase Details
Closed on
May 2, 2011
Sold by
Sok Kevin
Bought by
Federal National Mortgage Association
Current Estimated Value
Purchase Details
Closed on
Jul 25, 2005
Sold by
Merrill Tony Jason
Bought by
Sok Kevin
Home Financials for this Owner
Home Financials are based on the most recent Mortgage that was taken out on this home.
Original Mortgage
$158,000
Interest Rate
5.25%
Mortgage Type
Purchase Money Mortgage
Purchase Details
Closed on
May 20, 2002
Sold by
Abbott C N Kitt
Bought by
Sok Kevin and Merrill Tonya Jason
Home Financials for this Owner
Home Financials are based on the most recent Mortgage that was taken out on this home.
Original Mortgage
$129,750
Interest Rate
6.86%
Mortgage Type
New Conventional
Purchase Details
Closed on
Sep 24, 1998
Sold by
Abbott Julie D
Bought by
Abbott C N Kitt
Purchase Details
Closed on
May 19, 1998
Sold by
Chi Construction Company
Bought by
Continental Homes Inc
Create a Home Valuation Report for This Property
The Home Valuation Report is an in-depth analysis detailing your home's value as well as a comparison with similar homes in the area
Home Values in the Area
Average Home Value in this Area
Purchase History
| Date | Buyer | Sale Price | Title Company |
|---|---|---|---|
| Federal National Mortgage Association | $152,556 | Accommodation | |
| Sok Kevin | -- | -- | |
| Sok Kevin | $128,750 | Capital Title Agency Inc | |
| Abbott C N Kitt | -- | First American Title | |
| Abbott C N Kit | $103,720 | First American Title | |
| Continental Homes Inc | -- | First American Title |
Source: Public Records
Mortgage History
| Date | Status | Borrower | Loan Amount |
|---|---|---|---|
| Previous Owner | Sok Kevin | $158,000 | |
| Previous Owner | Sok Kevin | $129,750 |
Source: Public Records
Tax History Compared to Growth
Tax History
| Year | Tax Paid | Tax Assessment Tax Assessment Total Assessment is a certain percentage of the fair market value that is determined by local assessors to be the total taxable value of land and additions on the property. | Land | Improvement |
|---|---|---|---|---|
| 2025 | $1,322 | $16,970 | -- | -- |
| 2024 | $1,302 | $16,162 | -- | -- |
| 2023 | $1,302 | $28,330 | $5,660 | $22,670 |
| 2022 | $1,275 | $21,570 | $4,310 | $17,260 |
| 2021 | $1,365 | $19,770 | $3,950 | $15,820 |
| 2020 | $1,378 | $18,550 | $3,710 | $14,840 |
| 2019 | $1,333 | $16,900 | $3,380 | $13,520 |
| 2018 | $1,289 | $15,770 | $3,150 | $12,620 |
| 2017 | $1,290 | $14,280 | $2,850 | $11,430 |
| 2016 | $1,277 | $13,680 | $2,730 | $10,950 |
| 2015 | $1,191 | $13,250 | $2,650 | $10,600 |
Source: Public Records
Map
Nearby Homes
- 9529 W Runion Dr
- 9651 W Potter Dr
- 20424 N 96th Ln
- 20961 N 96th Dr
- 20967 N 96th Ln
- 9729 W Burnett Rd
- 20508 N 93rd Ln
- 9541 W Frank Ave
- 9561 W Frank Ave
- 9510 W Menadota Dr
- 9321 W Clara Ln
- 9331 W Harmony Ln
- 9627 W Menadota Dr
- 9331 W Runion Dr
- 9818 W Pontiac Dr
- 9551 W Sierra Pinta Dr
- 9457 W Albert Ln
- 9582 W Albert Ln
- 9403 W Escuda Dr
- 9250 W Runion Dr
- 9560 W Runion Dr
- 9548 W Runion Dr
- 9566 W Runion Dr
- 9553 W Irma Ln
- 9559 W Irma Ln
- 9547 W Irma Ln
- 9565 W Irma Ln
- 9541 W Irma Ln
- 9572 W Runion Dr
- 9536 W Runion Dr
- 9547 W Runion Dr
- 9553 W Runion Dr
- 9541 W Runion Dr
- 9571 W Irma Ln
- 9535 W Irma Ln
- 9578 W Runion Dr
- 9535 W Runion Dr
- 9565 W Runion Dr
- 9577 W Irma Ln
- 9571 W Runion Dr