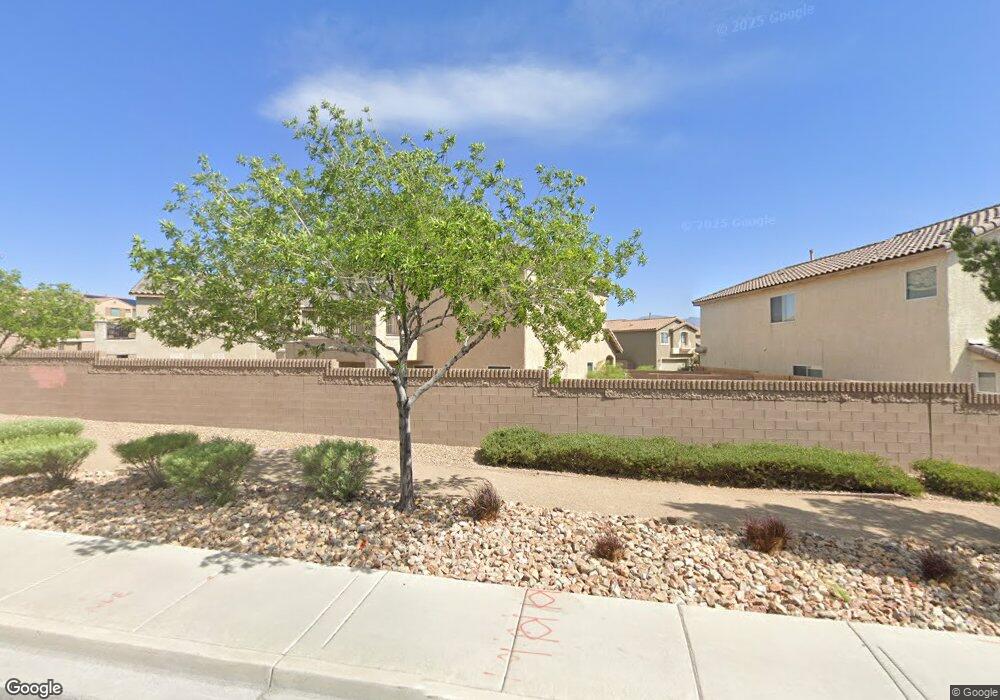
9557 Madsen Glen Ct Las Vegas, NV 89166
Estimated Value: $369,000 - $408,000
3
Beds
3
Baths
1,522
Sq Ft
$257/Sq Ft
Est. Value
About This Home
This home is located at 9557 Madsen Glen Ct, Las Vegas, NV 89166 and is currently estimated at $391,705, approximately $257 per square foot. 9557 Madsen Glen Ct is a home located in Clark County with nearby schools including James Bilbray Elementary School, William & Mary Scherkenbach Elementary School, and Edmundo "Eddie" Escobedo, Sr. Middle School.
Ownership History
Date
Name
Owned For
Owner Type
Purchase Details
Closed on
Jan 2, 2014
Sold by
Jameson Johannes E
Bought by
Sfr Investments Pool 1 Llc
Current Estimated Value
Purchase Details
Closed on
Jan 11, 2006
Sold by
Gechas Christine and Gechas Edwards
Bought by
Jameson Johannes E
Home Financials for this Owner
Home Financials are based on the most recent Mortgage that was taken out on this home.
Original Mortgage
$243,200
Interest Rate
6.21%
Mortgage Type
Fannie Mae Freddie Mac
Purchase Details
Closed on
Jul 22, 2004
Sold by
Beazer Homes Holdings Corp
Bought by
Gechas Edward and Gechas Christine
Home Financials for this Owner
Home Financials are based on the most recent Mortgage that was taken out on this home.
Original Mortgage
$210,800
Interest Rate
6%
Mortgage Type
Unknown
Create a Home Valuation Report for This Property
The Home Valuation Report is an in-depth analysis detailing your home's value as well as a comparison with similar homes in the area
Home Values in the Area
Average Home Value in this Area
Purchase History
| Date | Buyer | Sale Price | Title Company |
|---|---|---|---|
| Sfr Investments Pool 1 Llc | $12,500 | None Available | |
| Jameson Johannes E | $304,000 | Old Republic Title Co Of Nv | |
| Gechas Edward | $263,604 | First American Title Company |
Source: Public Records
Mortgage History
| Date | Status | Borrower | Loan Amount |
|---|---|---|---|
| Previous Owner | Jameson Johannes E | $243,200 | |
| Previous Owner | Gechas Edward | $210,800 | |
| Closed | Gechas Edward | $39,500 |
Source: Public Records
Tax History Compared to Growth
Tax History
| Year | Tax Paid | Tax Assessment Tax Assessment Total Assessment is a certain percentage of the fair market value that is determined by local assessors to be the total taxable value of land and additions on the property. | Land | Improvement |
|---|---|---|---|---|
| 2025 | $1,923 | $100,009 | $30,450 | $69,559 |
| 2024 | $1,781 | $100,009 | $30,450 | $69,559 |
| 2023 | $1,781 | $97,834 | $32,200 | $65,634 |
| 2022 | $1,649 | $86,135 | $26,250 | $59,885 |
| 2021 | $1,527 | $80,453 | $23,450 | $57,003 |
| 2020 | $1,415 | $79,428 | $23,100 | $56,328 |
| 2019 | $1,326 | $75,277 | $19,950 | $55,327 |
| 2018 | $1,266 | $69,308 | $16,100 | $53,208 |
| 2017 | $2,074 | $63,263 | $15,785 | $47,478 |
| 2016 | $1,186 | $56,732 | $11,550 | $45,182 |
| 2015 | $1,183 | $44,067 | $9,625 | $34,442 |
| 2014 | $1,146 | $33,907 | $7,000 | $26,907 |
Source: Public Records
Map
Nearby Homes
- 9553 Madsen Glen Ct
- 9668 Canyon Landing Ave
- 9461 Sweetwood Ave
- 9468 Plover Falls Ave
- 9408 Eagle River Ct
- 7849 Montour Falls St
- 9617 Sharp Horn Ct
- 9643 Wildflower Vista Ave
- 9612 Wildflower Vista Ave
- 7852 Running Doe Ct
- 9437 Plover Falls Ave
- 7928 Violet Dawn St
- 8250 N Grand Canyon Dr Unit 1166
- 8250 N Grand Canyon Dr Unit 1159
- 8250 N Grand Canyon Dr Unit 2110
- 8250 N Grand Canyon Dr Unit 2154
- 8250 N Grand Canyon Dr Unit 2001
- 7817 Ellendale Ct
- 7833 Blesbok Ct
- 9685 Bold Skye Ave
- 9561 Madsen Glen Ct
- 9549 Madsen Glen Ct
- 9558 Madsen Glen Ct
- 9545 Madsen Glen Ct
- 8033 Caspian Moon Dr
- 8033 Caspian Moon Dr Unit None
- 9552 Madsen Glen Ct
- 9548 Madsen Glen Ct
- 9544 Madsen Glen Ct
- 8029 Caspian Moon Dr
- 8045 Caspian Moon Dr
- 9562 Michelle Falls Ave
- 9558 Michelle Falls Ave
- 9566 Michelle Falls Ave
- 8032 Caspian Moon Dr
- 9554 Michelle Falls Ave
- 9570 Michelle Falls Ave
- 8040 Caspian Moon Dr
- 8040 Caspian Moon Dr Unit n/a
- 9550 Michelle Falls Ave