9559 Old State Line Rd Holland, OH 43528
Estimated Value: $378,977 - $442,000
4
Beds
2
Baths
2,350
Sq Ft
$171/Sq Ft
Est. Value
About This Home
This home is located at 9559 Old State Line Rd, Holland, OH 43528 and is currently estimated at $401,244, approximately $170 per square foot. 9559 Old State Line Rd is a home located in Lucas County with nearby schools including Crissey Elementary School, Springfield Middle School, and Springfield High School.
Ownership History
Date
Name
Owned For
Owner Type
Purchase Details
Closed on
Jul 10, 2013
Sold by
Murawski Susan F and Murawski Henry A
Bought by
Vas William P
Current Estimated Value
Home Financials for this Owner
Home Financials are based on the most recent Mortgage that was taken out on this home.
Original Mortgage
$160,000
Outstanding Balance
$115,900
Interest Rate
3.83%
Mortgage Type
Future Advance Clause Open End Mortgage
Estimated Equity
$285,344
Purchase Details
Closed on
Jul 9, 2008
Sold by
Murawski Henry A and Murawski Susan F
Bought by
Murawski Susan F and Murawski Henry A
Purchase Details
Closed on
Jul 11, 1996
Sold by
Tomaszewski Eugene
Bought by
Murawski Henry A and Murawski Susan F
Home Financials for this Owner
Home Financials are based on the most recent Mortgage that was taken out on this home.
Original Mortgage
$116,700
Interest Rate
6.75%
Mortgage Type
New Conventional
Create a Home Valuation Report for This Property
The Home Valuation Report is an in-depth analysis detailing your home's value as well as a comparison with similar homes in the area
Home Values in the Area
Average Home Value in this Area
Purchase History
| Date | Buyer | Sale Price | Title Company |
|---|---|---|---|
| Vas William P | $210,000 | Chicago Title Box | |
| Murawski Susan F | -- | Attorney | |
| Murawski Henry A | $21,000 | -- |
Source: Public Records
Mortgage History
| Date | Status | Borrower | Loan Amount |
|---|---|---|---|
| Open | Vas William P | $160,000 | |
| Previous Owner | Murawski Henry A | $116,700 |
Source: Public Records
Tax History Compared to Growth
Tax History
| Year | Tax Paid | Tax Assessment Tax Assessment Total Assessment is a certain percentage of the fair market value that is determined by local assessors to be the total taxable value of land and additions on the property. | Land | Improvement |
|---|---|---|---|---|
| 2024 | $3,332 | $110,180 | $18,550 | $91,630 |
| 2023 | $5,232 | $70,980 | $10,255 | $60,725 |
| 2022 | $5,232 | $70,980 | $10,255 | $60,725 |
| 2021 | $4,937 | $70,980 | $10,255 | $60,725 |
| 2020 | $4,550 | $58,940 | $8,505 | $50,435 |
| 2019 | $4,452 | $58,940 | $8,505 | $50,435 |
| 2018 | $4,250 | $58,940 | $8,505 | $50,435 |
| 2017 | $4,082 | $50,050 | $12,845 | $37,205 |
| 2016 | $4,117 | $143,000 | $36,700 | $106,300 |
| 2015 | $4,111 | $143,000 | $36,700 | $106,300 |
| 2014 | $3,399 | $48,130 | $12,360 | $35,770 |
| 2013 | $3,399 | $48,130 | $12,360 | $35,770 |
Source: Public Records
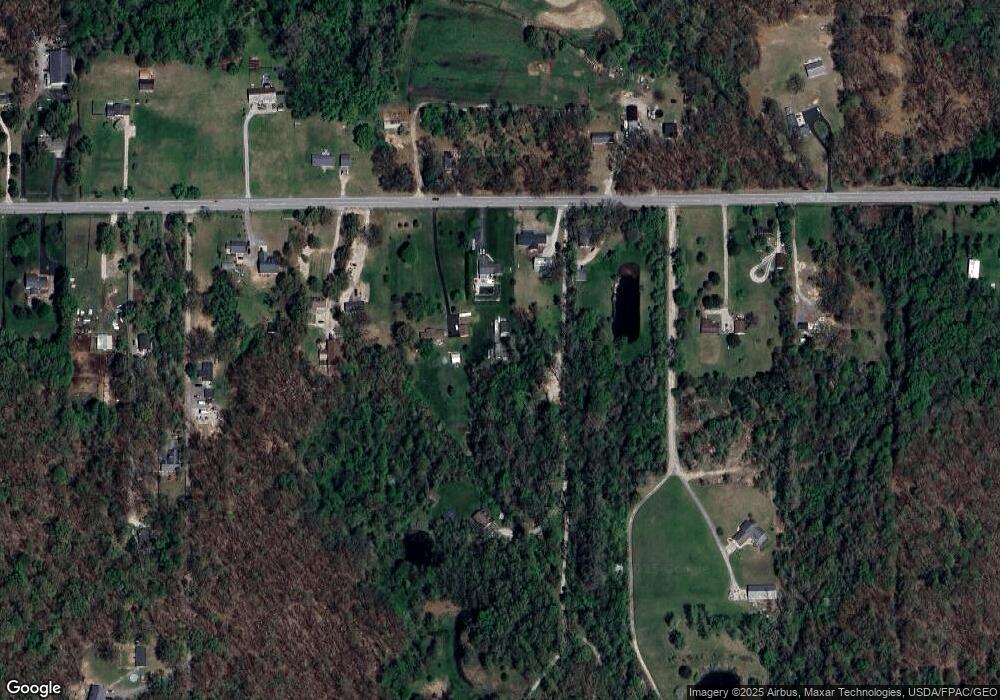
Map
Nearby Homes
- 1402 S Crissey Rd
- 8733 Saint George Dr
- 8945 Oak Valley Rd
- 8535 Airport Hwy
- 9151 Rolling Hill Rd
- 8451 Airport Hwy
- 612 S Centennial Rd
- 540 S Centennial Rd
- 8617 Ponte Vedra Ct
- 8435 Willow Glen Ct
- 8553 Stone Oak Dr
- 8670 Augusta Ln
- 215 Stone Oak Ct
- 44 Treetop Place
- 1938 Huntley St
- 1021 N Crissey Rd
- 816 N Crissey Rd
- 7 Tremore Way
- 630 N Schwamberger Rd
- 7839 Airport Hwy
- 9545 Old State Line Rd
- 9611 Old State Line Rd
- 9525 Old State Line Rd
- 9617 Old State Line Rd
- 9623 Old State Line Rd
- 9612 Old State Line Rd
- 9660 Old State Line Rd
- 9685 Old State Line Rd
- 9455 Old State Line Rd
- 9616 Old State Line Rd
- 9637 Old State Line Rd
- 9539 Old State Line Rd
- 9445 Old State Line Rd
- 9670 Old State Line Rd
- 9425 Old State Line Rd
- 9707 Old State Line Rd
- 9450 Old State Line Rd
- 9717 Old State Line Rd
- 9765 Old State Line Rd
- 9750 Old State Line Rd