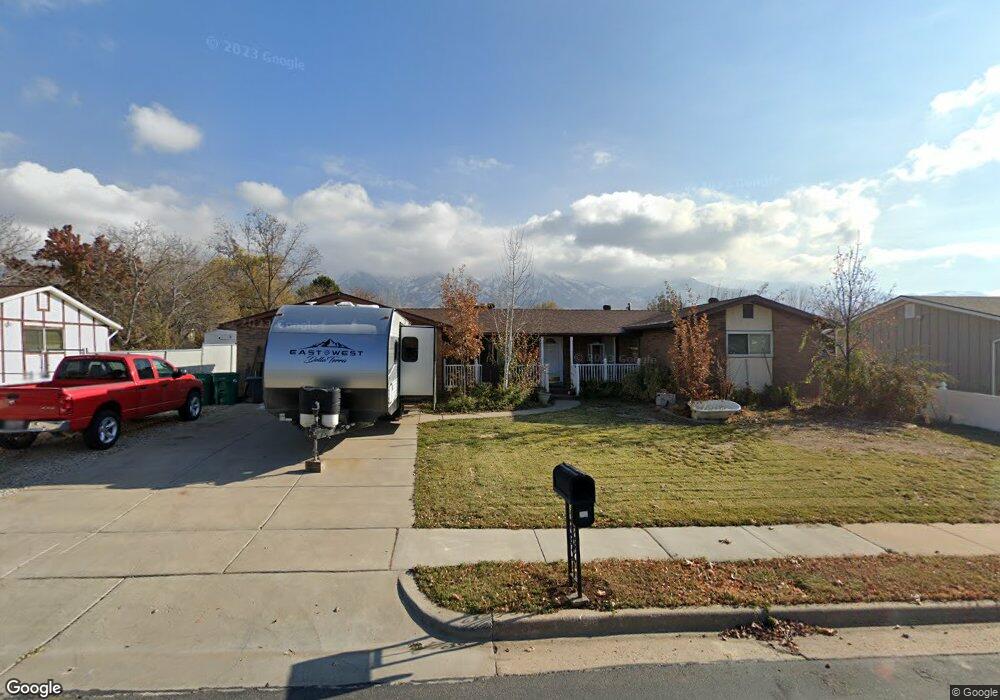
956 Aspen Way Layton, UT 84040
Estimated Value: $493,000 - $534,000
4
Beds
3
Baths
2,304
Sq Ft
$224/Sq Ft
Est. Value
About This Home
This home is located at 956 Aspen Way, Layton, UT 84040 and is currently estimated at $515,485, approximately $223 per square foot. 956 Aspen Way is a home located in Davis County with nearby schools including King Elementary School, Central Davis Junior High School, and Layton High School.
Ownership History
Date
Name
Owned For
Owner Type
Purchase Details
Closed on
Jul 9, 2021
Sold by
Guin Raymonde Jeanette
Bought by
Guin Alfred R and Revoca Raymonde
Current Estimated Value
Home Financials for this Owner
Home Financials are based on the most recent Mortgage that was taken out on this home.
Original Mortgage
$416,310
Outstanding Balance
$374,445
Interest Rate
2.9%
Mortgage Type
New Conventional
Estimated Equity
$141,040
Purchase Details
Closed on
Jul 6, 2021
Sold by
Lyon Denise R and Guin Alfred R
Bought by
Obermiller Edward
Home Financials for this Owner
Home Financials are based on the most recent Mortgage that was taken out on this home.
Original Mortgage
$416,310
Outstanding Balance
$374,445
Interest Rate
2.9%
Mortgage Type
New Conventional
Estimated Equity
$141,040
Purchase Details
Closed on
Jun 6, 2017
Sold by
Guin Alfred R and Guin Raymonde J
Bought by
Alfred R Guin and Guin Revocable Living Trust
Purchase Details
Closed on
Aug 28, 2000
Sold by
Iverson Myren and Iverson Anne E
Bought by
Guin Alfred R and Guin Raymonde J
Create a Home Valuation Report for This Property
The Home Valuation Report is an in-depth analysis detailing your home's value as well as a comparison with similar homes in the area
Home Values in the Area
Average Home Value in this Area
Purchase History
| Date | Buyer | Sale Price | Title Company |
|---|---|---|---|
| Guin Alfred R | -- | -- | |
| Obermiller Edward | -- | Inwest Title Services Inc | |
| Alfred R Guin | -- | -- | |
| Guin Alfred R | -- | Bonneville Title Company Inc |
Source: Public Records
Mortgage History
| Date | Status | Borrower | Loan Amount |
|---|---|---|---|
| Open | Obermiller Edward | $416,310 |
Source: Public Records
Tax History
| Year | Tax Paid | Tax Assessment Tax Assessment Total Assessment is a certain percentage of the fair market value that is determined by local assessors to be the total taxable value of land and additions on the property. | Land | Improvement |
|---|---|---|---|---|
| 2025 | $2,337 | $245,300 | $180,552 | $64,748 |
| 2024 | $2,247 | $237,600 | $191,982 | $45,618 |
| 2023 | $2,216 | $413,000 | $236,966 | $176,034 |
| 2022 | $2,315 | $234,300 | $128,962 | $105,338 |
| 2021 | $2,266 | $342,000 | $199,276 | $142,724 |
| 2020 | $1,662 | $285,000 | $173,849 | $111,151 |
| 2019 | $1,662 | $276,000 | $152,526 | $123,474 |
| 2018 | $0 | $252,000 | $129,033 | $122,967 |
| 2016 | $1,618 | $118,855 | $65,710 | $53,145 |
| 2015 | $1,583 | $110,385 | $65,710 | $44,675 |
| 2014 | $123 | $108,060 | $65,710 | $42,350 |
| 2013 | -- | $101,783 | $27,195 | $74,588 |
Source: Public Records
Map
Nearby Homes
- 997 E 825 N
- 1033 E 825 N
- 861 E 575 N
- 857 E 575 N
- 806 Valeria Dr
- 800 Kirk St
- 556 N Fairfield Rd Unit A2
- 556 N Fairfield Rd Unit D1
- 556 N Fairfield Rd Unit D2
- 556 N Fairfield Rd Unit A3
- 556 N Fairfield Rd Unit D3
- 556 N Fairfield Rd Unit D4
- 556 N Fairfield Rd Unit A1
- 556 N Fairfield Rd Unit A4
- 508 N Adamswood Rd
- 1048 E Cherry Ln
- 540 E Quail Ln N
- 618 Valeria Dr
- 479 N 1375 E
- 1503 E 530 N
Your Personal Tour Guide
Ask me questions while you tour the home.