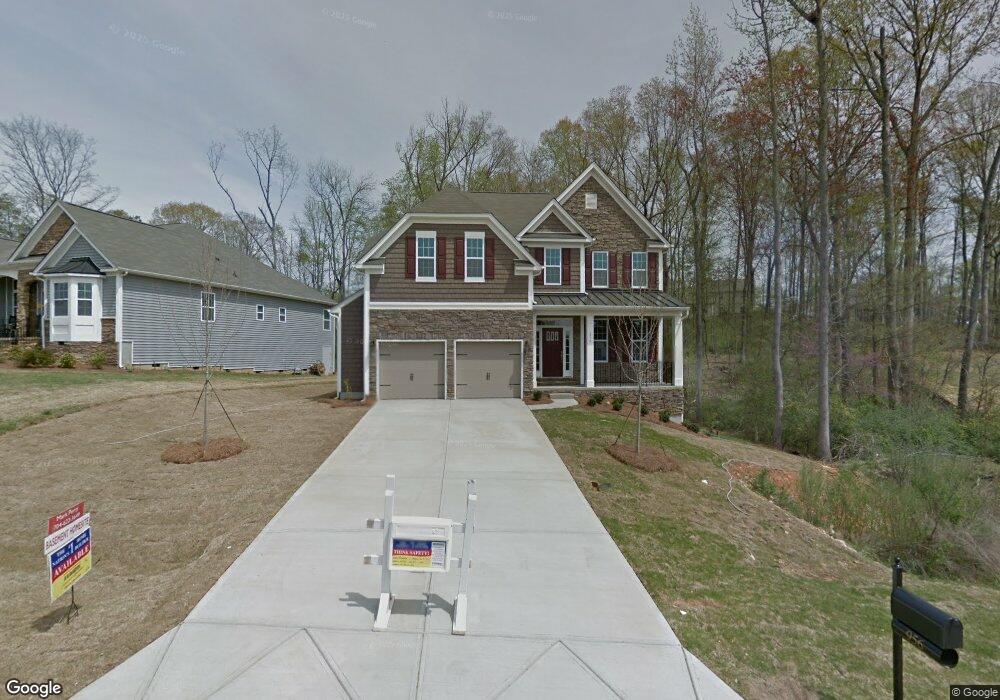
956 Autumn Glen Ct Unit 34 Clover, SC 29710
Estimated Value: $551,404 - $576,000
5
Beds
3
Baths
2,643
Sq Ft
$214/Sq Ft
Est. Value
About This Home
This home is located at 956 Autumn Glen Ct Unit 34, Clover, SC 29710 and is currently estimated at $564,601, approximately $213 per square foot. 956 Autumn Glen Ct Unit 34 is a home located in York County with nearby schools including Crowders Creek Elementary School, Oakridge Middle School, and Clover High School.
Ownership History
Date
Name
Owned For
Owner Type
Purchase Details
Closed on
Aug 26, 2019
Sold by
Coonrod Garrett and Coonrod Ashton
Bought by
Turley Sarah and Turley Christopher
Current Estimated Value
Home Financials for this Owner
Home Financials are based on the most recent Mortgage that was taken out on this home.
Original Mortgage
$337,250
Outstanding Balance
$296,008
Interest Rate
3.7%
Mortgage Type
New Conventional
Estimated Equity
$268,593
Purchase Details
Closed on
Feb 11, 2015
Sold by
D R Horton Inc
Bought by
Walker Matt Conley
Home Financials for this Owner
Home Financials are based on the most recent Mortgage that was taken out on this home.
Original Mortgage
$261,250
Interest Rate
3.98%
Mortgage Type
New Conventional
Purchase Details
Closed on
Dec 31, 2014
Sold by
D R Horton Inc
Bought by
Walker Matt Conley
Home Financials for this Owner
Home Financials are based on the most recent Mortgage that was taken out on this home.
Original Mortgage
$261,250
Interest Rate
3.98%
Mortgage Type
New Conventional
Create a Home Valuation Report for This Property
The Home Valuation Report is an in-depth analysis detailing your home's value as well as a comparison with similar homes in the area
Home Values in the Area
Average Home Value in this Area
Purchase History
| Date | Buyer | Sale Price | Title Company |
|---|---|---|---|
| Turley Sarah | $355,000 | None Available | |
| Walker Matt Conley | -- | -- | |
| Walker Matt Conley | $275,000 | -- |
Source: Public Records
Mortgage History
| Date | Status | Borrower | Loan Amount |
|---|---|---|---|
| Open | Turley Sarah | $337,250 | |
| Previous Owner | Walker Matt Conley | $261,250 |
Source: Public Records
Tax History Compared to Growth
Tax History
| Year | Tax Paid | Tax Assessment Tax Assessment Total Assessment is a certain percentage of the fair market value that is determined by local assessors to be the total taxable value of land and additions on the property. | Land | Improvement |
|---|---|---|---|---|
| 2025 | $2,235 | $16,327 | $2,263 | $14,064 |
| 2024 | $2,006 | $14,197 | $2,600 | $11,597 |
| 2023 | $2,056 | $14,192 | $2,600 | $11,592 |
| 2022 | $1,695 | $14,192 | $2,600 | $11,592 |
| 2021 | -- | $14,192 | $2,600 | $11,592 |
| 2020 | $1,607 | $14,192 | $0 | $0 |
| 2019 | $1,554 | $20,970 | $0 | $0 |
| 2018 | $6,621 | $18,870 | $0 | $0 |
| 2017 | $1,239 | $12,580 | $0 | $0 |
| 2016 | $1,167 | $10,720 | $0 | $0 |
| 2014 | $271 | $16,080 | $2,700 | $13,380 |
| 2013 | $271 | $3,000 | $3,000 | $0 |
Source: Public Records
Map
Nearby Homes
- 1026 Valley Forge Dr
- 1032 Valley Forge Dr
- 1411 Swaying Branch Ln
- 743 Waterfall Way
- 481 Evergreen Rd
- 2095 Shady Pond Dr
- 46 Timberidge Dr
- 2099 Shady Pond Dr
- 1437 Harpers Inlet Dr
- 341 Windy Pine Dr
- 5426 Riverfront Rd
- 121 Misty Woods Dr
- 126 Misty Woods Dr
- 2180 Shady Pond Dr
- 447 Leaf Arbor Ct
- 8 Hickory Ridge Ct
- 335 Carroll Cove
- 5165 Sapp Cir
- 2323 Branch Hill Ln
- 5141 Sapp Cir
- 956 Autumn Glen Ct
- 968 Autumn Glen Ct Unit 35
- 968 Autumn Glen Ct
- 932 Autumn Glen Ct Unit 33
- 980 Autumn Glen Ct
- 957 Autumn Glen Ct
- 949 Autumn Glen Ct
- 949 Autumn Glen Ct Unit 44
- 924 Autumn Glen Ct Unit 33
- 924 Autumn Glen Ct Unit 32
- 924 Autumn Glen Ct
- 988 Autumn Glen Ct Unit 37
- 988 Autumn Glen Ct
- 965 Autumn Glen Ct Unit 42
- 795 Virginia Pine Ln
- 813 Virginia Pine Ln
- 813 Virginia Pine Ln Unit 26
- 805 Virginia Pine Ln
- 981 Autumn Glen Ct
- 973 Autumn Glen Ct Unit 41