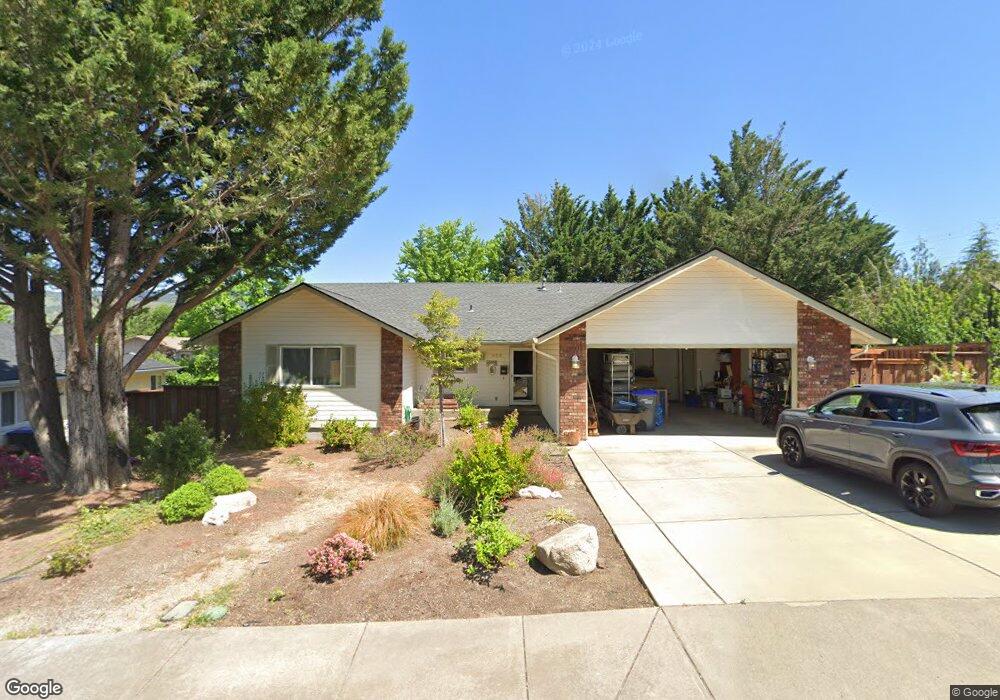
956 Cypress Point Loop Ashland, OR 97520
Oak Knoll NeighborhoodEstimated Value: $461,204 - $499,000
2
Beds
2
Baths
1,600
Sq Ft
$295/Sq Ft
Est. Value
About This Home
This home is located at 956 Cypress Point Loop, Ashland, OR 97520 and is currently estimated at $472,301, approximately $295 per square foot. 956 Cypress Point Loop is a home located in Jackson County with nearby schools including Bellview Elementary School, Ashland Middle School, and Ashland High School.
Ownership History
Date
Name
Owned For
Owner Type
Purchase Details
Closed on
Apr 26, 2019
Sold by
Young Norma
Bought by
Revocabl Young Norma Jean and 2016 Norma Jean Young Revocable Trust
Current Estimated Value
Home Financials for this Owner
Home Financials are based on the most recent Mortgage that was taken out on this home.
Original Mortgage
$269,250
Outstanding Balance
$235,754
Interest Rate
4.4%
Mortgage Type
New Conventional
Estimated Equity
$236,547
Purchase Details
Closed on
Apr 16, 2019
Sold by
Schelb Galen Myron and Schelb Mary M
Bought by
Young Norma
Home Financials for this Owner
Home Financials are based on the most recent Mortgage that was taken out on this home.
Original Mortgage
$269,250
Outstanding Balance
$235,754
Interest Rate
4.4%
Mortgage Type
New Conventional
Estimated Equity
$236,547
Purchase Details
Closed on
Jun 16, 2011
Sold by
Frost Paul R and Frost Virginia H
Bought by
Schelb Galen Myron and Schelb Mary M
Create a Home Valuation Report for This Property
The Home Valuation Report is an in-depth analysis detailing your home's value as well as a comparison with similar homes in the area
Home Values in the Area
Average Home Value in this Area
Purchase History
| Date | Buyer | Sale Price | Title Company |
|---|---|---|---|
| Revocabl Young Norma Jean | -- | None Available | |
| Young Norma | $359,000 | Ticor Title | |
| Schelb Galen Myron | $250,000 | First American |
Source: Public Records
Mortgage History
| Date | Status | Borrower | Loan Amount |
|---|---|---|---|
| Open | Young Norma | $269,250 |
Source: Public Records
Tax History
| Year | Tax Paid | Tax Assessment Tax Assessment Total Assessment is a certain percentage of the fair market value that is determined by local assessors to be the total taxable value of land and additions on the property. | Land | Improvement |
|---|---|---|---|---|
| 2026 | $4,392 | $291,320 | -- | -- |
| 2025 | $4,301 | $282,840 | $157,520 | $125,320 |
| 2024 | $4,301 | $274,610 | $152,940 | $121,670 |
| 2023 | $4,161 | $266,620 | $148,490 | $118,130 |
| 2022 | $4,027 | $266,620 | $148,490 | $118,130 |
| 2021 | $3,890 | $258,860 | $144,170 | $114,690 |
| 2020 | $3,780 | $251,330 | $139,980 | $111,350 |
| 2019 | $3,722 | $236,910 | $131,950 | $104,960 |
| 2018 | $3,514 | $230,010 | $128,110 | $101,900 |
| 2017 | $3,490 | $230,010 | $128,110 | $101,900 |
| 2016 | $3,399 | $216,820 | $120,770 | $96,050 |
| 2015 | $3,295 | $216,820 | $120,770 | $96,050 |
| 2014 | $3,188 | $204,380 | $113,850 | $90,530 |
Source: Public Records
Map
Nearby Homes
- 1120 Barrington Cir
- 938 Cypress Point Loop
- 1087 Oak Knoll Dr
- 376 Crowson Rd
- 488 Crowson Rd
- 854 Twin Pines Cir Unit 7
- 738 Fairway Ct
- 805 Oak Knoll Dr
- 2799 Siskiyou Blvd Unit 7
- 2799 Siskiyou Blvd Unit 36
- 288 Maywood Way
- 766 E Jefferson Ave
- 601 Washington St
- 551 Sutton Place
- 0 Dead Indian Memorial Rd Unit 1400
- 996 Spring Way
- 30 Knoll Crest Dr
- 582 Washington St
- 510 Washington St
- 3152 Siskiyou Blvd
- 950 Cypress Point Loop
- 962 Cypress Point Loop
- 1130 Barrington Cir
- 1140 Barrington Cir
- 1120 Oak Knoll Dr
- 944 Cypress Point Loop
- 947 Cypress Point Loop
- 0 Barrington Cir
- 1114 Barrington Cir
- 1114 Oak Knoll Dr
- 941 Cypress Point Loop
- 799 St Andrews Cir
- 798 St Andrews Cir
- 1131 Barrington Cir
- 1110 Barrington Cir
- 308 Crowson Rd
- 935 Cypress Point Loop
- 1121 Barrington Cir
- 1111 Oak Knoll Dr
- 793 St Andrews Cir
Your Personal Tour Guide
Ask me questions while you tour the home.