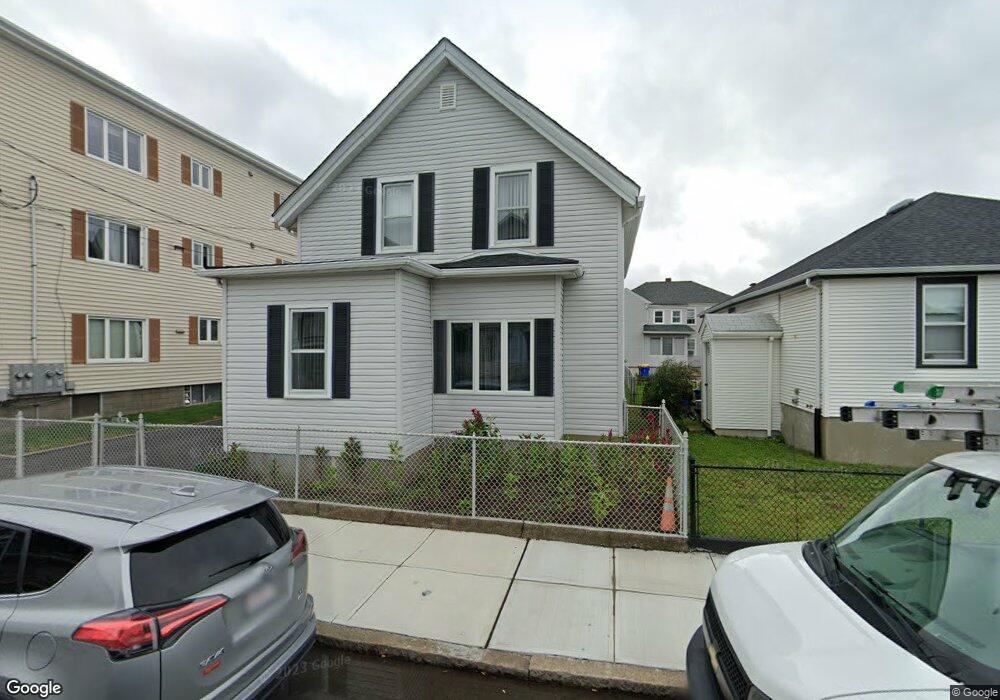
956 Globe St Fall River, MA 02724
Father Kelly NeighborhoodEstimated Value: $357,000 - $412,000
3
Beds
2
Baths
1,202
Sq Ft
$318/Sq Ft
Est. Value
About This Home
This home is located at 956 Globe St, Fall River, MA 02724 and is currently estimated at $382,828, approximately $318 per square foot. 956 Globe St is a home located in Bristol County with nearby schools including Henry Lord Community School, B M C Durfee High School, and Argosy Collegiate Charter School.
Ownership History
Date
Name
Owned For
Owner Type
Purchase Details
Closed on
Sep 24, 1992
Sold by
Cabral Maria L
Bought by
Goncalves David B and Soares Irene
Current Estimated Value
Home Financials for this Owner
Home Financials are based on the most recent Mortgage that was taken out on this home.
Original Mortgage
$80,000
Interest Rate
7.9%
Mortgage Type
Purchase Money Mortgage
Create a Home Valuation Report for This Property
The Home Valuation Report is an in-depth analysis detailing your home's value as well as a comparison with similar homes in the area
Home Values in the Area
Average Home Value in this Area
Purchase History
| Date | Buyer | Sale Price | Title Company |
|---|---|---|---|
| Goncalves David B | $90,000 | -- |
Source: Public Records
Mortgage History
| Date | Status | Borrower | Loan Amount |
|---|---|---|---|
| Closed | Goncalves David B | $80,000 |
Source: Public Records
Tax History
| Year | Tax Paid | Tax Assessment Tax Assessment Total Assessment is a certain percentage of the fair market value that is determined by local assessors to be the total taxable value of land and additions on the property. | Land | Improvement |
|---|---|---|---|---|
| 2025 | $3,483 | $304,200 | $108,100 | $196,100 |
| 2024 | $3,287 | $286,100 | $104,100 | $182,000 |
| 2023 | $3,043 | $248,000 | $86,000 | $162,000 |
| 2022 | $2,853 | $226,100 | $81,900 | $144,200 |
| 2021 | $2,672 | $193,200 | $77,900 | $115,300 |
| 2020 | $2,704 | $187,100 | $76,800 | $110,300 |
| 2019 | $2,601 | $178,400 | $73,900 | $104,500 |
| 2018 | $2,497 | $170,800 | $80,100 | $90,700 |
| 2017 | $2,328 | $166,300 | $76,300 | $90,000 |
| 2016 | $2,272 | $166,700 | $81,200 | $85,500 |
| 2015 | $2,180 | $166,700 | $81,200 | $85,500 |
| 2014 | $2,067 | $164,300 | $78,800 | $85,500 |
Source: Public Records
Map
Nearby Homes
Your Personal Tour Guide
Ask me questions while you tour the home.