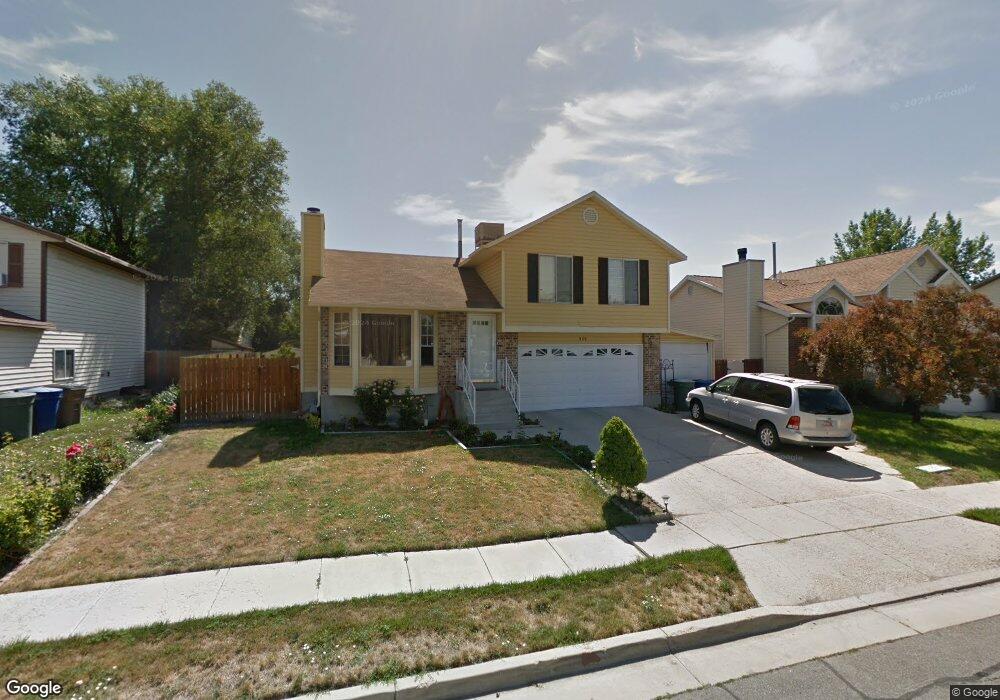
956 Libby Way Salt Lake City, UT 84116
Westpointe NeighborhoodEstimated Value: $480,776 - $501,000
4
Beds
3
Baths
1,781
Sq Ft
$275/Sq Ft
Est. Value
About This Home
This home is located at 956 Libby Way, Salt Lake City, UT 84116 and is currently estimated at $489,944, approximately $275 per square foot. 956 Libby Way is a home located in Salt Lake County with nearby schools including Escalante Elementary School, Northwest Middle School, and West High.
Ownership History
Date
Name
Owned For
Owner Type
Purchase Details
Closed on
Nov 26, 2018
Sold by
Ribar Valentina
Bought by
Ribar Robert and Ribar Valentina
Current Estimated Value
Purchase Details
Closed on
Jun 4, 2018
Sold by
Blanco Miguel
Bought by
Blanco Miguel A
Home Financials for this Owner
Home Financials are based on the most recent Mortgage that was taken out on this home.
Original Mortgage
$213,675
Outstanding Balance
$186,303
Interest Rate
4.87%
Mortgage Type
FHA
Estimated Equity
$303,641
Purchase Details
Closed on
Jan 21, 1999
Sold by
Tran Tuy V and Vo Phuong Thi
Bought by
Vucak Tadija and Vucak Gordana
Home Financials for this Owner
Home Financials are based on the most recent Mortgage that was taken out on this home.
Original Mortgage
$123,810
Interest Rate
6.63%
Mortgage Type
FHA
Purchase Details
Closed on
Jul 8, 1998
Sold by
Truelsen Robert L
Bought by
Tran Tuy and Vo Phuong Thi
Home Financials for this Owner
Home Financials are based on the most recent Mortgage that was taken out on this home.
Original Mortgage
$108,900
Interest Rate
7.03%
Create a Home Valuation Report for This Property
The Home Valuation Report is an in-depth analysis detailing your home's value as well as a comparison with similar homes in the area
Home Values in the Area
Average Home Value in this Area
Purchase History
| Date | Buyer | Sale Price | Title Company |
|---|---|---|---|
| Ribar Robert | -- | Artisan Title | |
| Blanco Miguel A | -- | Novation Title | |
| Vucak Tadija | -- | Equity Title | |
| Tran Tuy | -- | -- |
Source: Public Records
Mortgage History
| Date | Status | Borrower | Loan Amount |
|---|---|---|---|
| Open | Blanco Miguel A | $213,675 | |
| Closed | Vucak Tadija | $123,810 | |
| Previous Owner | Tran Tuy | $108,900 |
Source: Public Records
Tax History Compared to Growth
Tax History
| Year | Tax Paid | Tax Assessment Tax Assessment Total Assessment is a certain percentage of the fair market value that is determined by local assessors to be the total taxable value of land and additions on the property. | Land | Improvement |
|---|---|---|---|---|
| 2025 | $2,234 | $485,900 | $117,800 | $368,100 |
| 2024 | $2,234 | $426,300 | $111,500 | $314,800 |
| 2023 | $2,206 | $405,800 | $107,200 | $298,600 |
| 2022 | $2,379 | $410,500 | $105,100 | $305,400 |
| 2021 | $2,148 | $335,500 | $79,900 | $255,600 |
| 2020 | $2,032 | $302,100 | $71,300 | $230,800 |
| 2019 | $1,778 | $248,800 | $58,100 | $190,700 |
| 2018 | $1,633 | $222,500 | $58,100 | $164,400 |
| 2017 | $1,718 | $219,300 | $58,100 | $161,200 |
| 2016 | $1,653 | $200,300 | $48,800 | $151,500 |
| 2015 | $1,523 | $175,000 | $47,800 | $127,200 |
| 2014 | $1,339 | $152,600 | $46,900 | $105,700 |
Source: Public Records
Map
Nearby Homes
- 949 Libby Way
- 1827 Omni Ave
- 1004 N Sir Michael Dr
- 825 Star Crest Dr W
- 1989 Sir Timothy Ave
- 1178 N Reveille Cir
- 768 N Redwood Rd Unit 19
- 768 N Redwood Rd Unit 1
- 1245 W Siena Cir
- 1793 W Trafalga Way Unit F
- 1770 W Trafalga Way Unit B
- 555 N Starcrest Dr Unit B15
- 1978 Sir Robert Dr
- 1860 W 500 N Unit 20
- 1860 W 500 N Unit 7
- 1281 Carousel St
- 1762 W Irie Ln
- 558 N Redwood Rd Unit 1
- 558 N Redwood Rd Unit 3
- 548 N Redwood Rd
- 956 N Libby Way
- 960 Libby Way
- 960 N Libby Way
- 952 N Libby Way
- 952 Libby Way
- 957 Dorothea Way
- 949 Dorothea Way
- 965 Dorothea Way
- 944 Libby Way
- 944 N Libby Way
- 966 Libby Way
- 966 N Libby Way
- 953 N Libby Way
- 953 Libby Way
- 957 Libby Way
- 941 Dorothea Way
- 971 Dorothea Way
- 961 Libby Way
- 936 Libby Way
- 945 N Libby Way