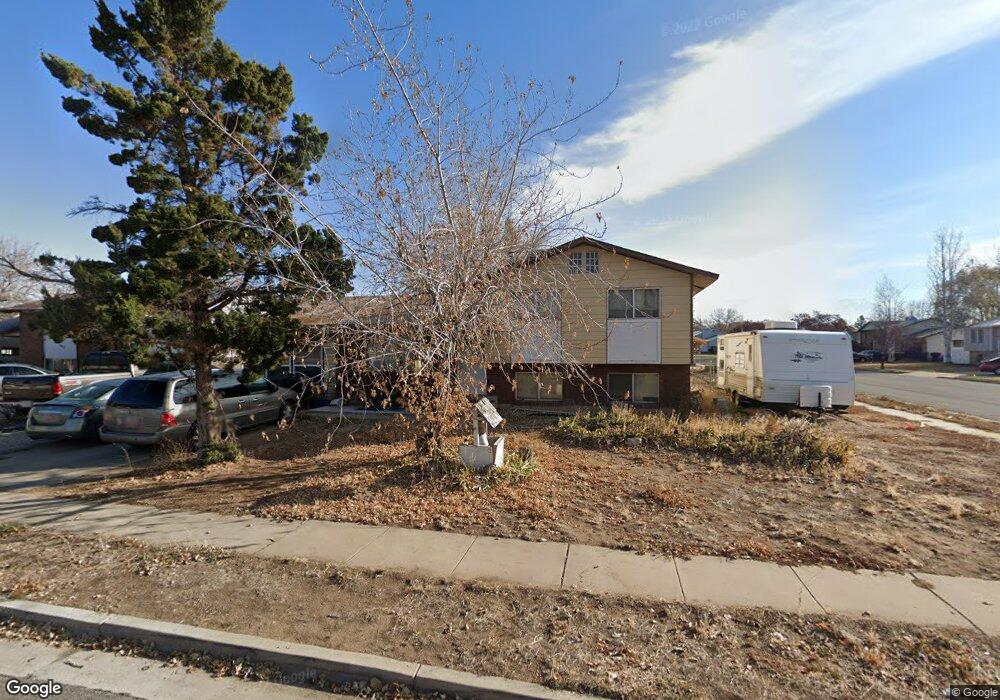
956 N 1175 W Clearfield, UT 84015
Estimated Value: $371,000 - $447,000
4
Beds
2
Baths
1,450
Sq Ft
$284/Sq Ft
Est. Value
About This Home
This home is located at 956 N 1175 W, Clearfield, UT 84015 and is currently estimated at $411,512, approximately $283 per square foot. 956 N 1175 W is a home located in Davis County with nearby schools including Clinton Elementary School, Sunset Junior High School, and Clearfield High School.
Ownership History
Date
Name
Owned For
Owner Type
Purchase Details
Closed on
May 26, 2017
Sold by
Gao Wei and Lin Qin
Bought by
Gee David Charles and Gee Natalie Bell
Current Estimated Value
Home Financials for this Owner
Home Financials are based on the most recent Mortgage that was taken out on this home.
Original Mortgage
$176,700
Outstanding Balance
$146,665
Interest Rate
4.03%
Mortgage Type
New Conventional
Estimated Equity
$264,847
Purchase Details
Closed on
Jan 28, 2016
Sold by
Re New Homes & Unvestments Inc
Bought by
Gao Wei and Lin Qin
Purchase Details
Closed on
Sep 16, 1998
Sold by
Tafoya Paul H
Bought by
Tafoya Paul H and Tafoya Cindy
Home Financials for this Owner
Home Financials are based on the most recent Mortgage that was taken out on this home.
Original Mortgage
$102,000
Interest Rate
10.12%
Create a Home Valuation Report for This Property
The Home Valuation Report is an in-depth analysis detailing your home's value as well as a comparison with similar homes in the area
Home Values in the Area
Average Home Value in this Area
Purchase History
| Date | Buyer | Sale Price | Title Company |
|---|---|---|---|
| Gee David Charles | -- | Inwest Title | |
| Gao Wei | -- | Mountain View Title | |
| Tafoya Paul H | -- | Home Abst & Title Co |
Source: Public Records
Mortgage History
| Date | Status | Borrower | Loan Amount |
|---|---|---|---|
| Open | Gee David Charles | $176,700 | |
| Previous Owner | Tafoya Paul H | $102,000 |
Source: Public Records
Tax History Compared to Growth
Tax History
| Year | Tax Paid | Tax Assessment Tax Assessment Total Assessment is a certain percentage of the fair market value that is determined by local assessors to be the total taxable value of land and additions on the property. | Land | Improvement |
|---|---|---|---|---|
| 2025 | $2,322 | $200,750 | $89,121 | $111,629 |
| 2024 | $2,049 | $198,001 | $97,620 | $100,381 |
| 2023 | $1,991 | $356,000 | $111,669 | $244,331 |
| 2022 | $2,051 | $202,950 | $67,574 | $135,376 |
| 2021 | $1,819 | $267,000 | $85,838 | $181,162 |
| 2020 | $1,577 | $229,000 | $73,604 | $155,396 |
| 2019 | $1,515 | $215,000 | $84,781 | $130,219 |
| 2018 | $1,392 | $194,000 | $71,450 | $122,550 |
| 2016 | $1,621 | $80,410 | $27,961 | $52,449 |
| 2015 | $1,095 | $74,965 | $27,961 | $47,004 |
| 2014 | $1,158 | $80,503 | $27,961 | $52,542 |
| 2013 | -- | $71,870 | $25,230 | $46,640 |
Source: Public Records
Map
Nearby Homes
- 984 N 1100 W
- 1038 W 800 N
- 844 N 1000 W
- 1242 W 1075 N
- 1121 N 900 W
- 690 Barlow St
- 563 N 1350 W Unit 139
- 1337 W 550 N Unit 195
- 1350 W 300 N Unit 49
- 1350 W 300 N Unit 38
- 1350 W 300 N Unit 29
- 721 N 800 W
- 423 N 1250 W Unit 118
- 417 N 1200 W Unit 84
- 575 N 1350 W Unit 137
- 626 W 800 N
- 1251 W 400 N Unit 67
- 1239 W 400 N Unit 63
- 1214 N 700 W
- 1654 W 600 N